
Community Infrastructure Series
The Data Center Next Door: What a Hyperscale Facility Really Means for Your Community
Every county weighing a data center proposal is really weighing three separate questions at once: what happens to the power grid, what happens to the water supply, and what happens to the town once the construction trucks leave. Here’s what the evidence actually shows.
A single hyperscale data center campus can draw as much electricity as an entire mid-sized American city, consume as much water per day as a town of thousands, and reshape a rural county’s tax base, water rights, and grid reliability for a generation. Nationwide, more than 2,000 data centers are already operating, with hundreds more under construction and thousands more announced or planned. As artificial intelligence demand accelerates that buildout, communities from Georgia to Utah are discovering that the decisions made at a single zoning hearing can ripple through the regional power grid, the local water utility, and the county budget for decades.
This article walks through what a data center actually needs to operate, how those needs cascade into local and regional infrastructure, what the evidence says about jobs, tax revenue, and property values, and where the current U.S. buildout stands state by state.
A Data Center Is a Second City Arriving in Your County
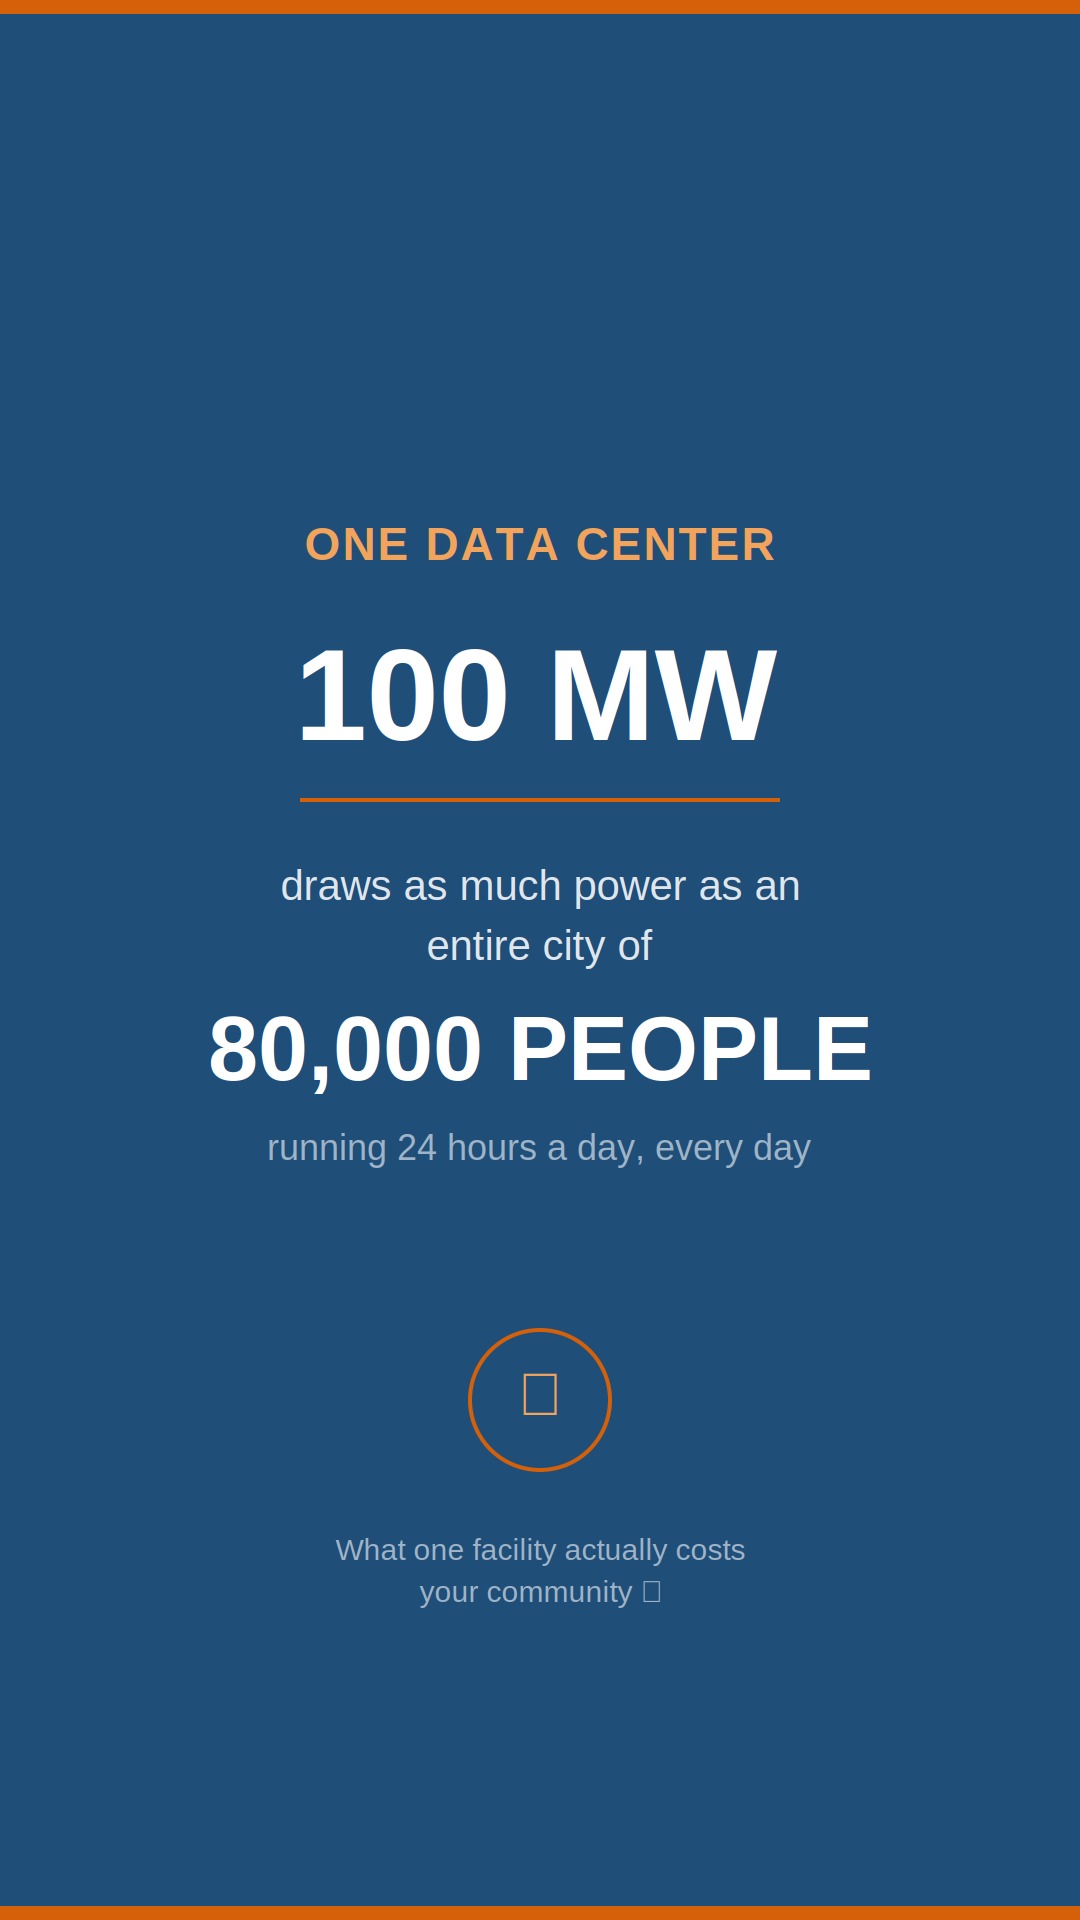
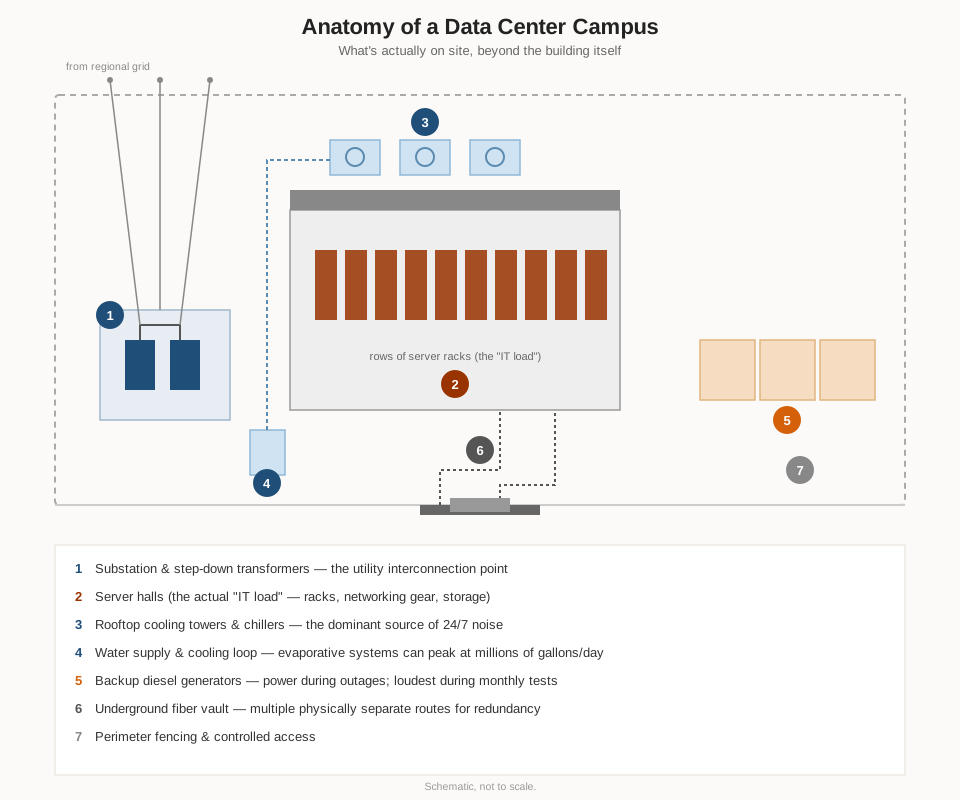
A data center is, physically, a warehouse full of computer servers, networking equipment, and the cooling and backup-power systems needed to keep them running around the clock. What makes them different from a normal warehouse is scale: a single 100-megawatt (MW) facility — a mid-size hyperscale building by 2026 standards — draws roughly the same steady electricity load as every home in a city the size of Asheville, NC, or Topeka, KS, combined. A 200 MW campus is the equivalent of adding a city the size of Salt Lake City to the local grid. The largest AI campuses now under construction — OpenAI’s Stargate Phase 2 (1,200 MW) or Utah’s proposed Stratos project (7,500–9,000 MW at full build) — would draw as much power as the entire city of Phoenix or San Francisco, layered on top of whatever the host county already needs.
By the numbers (2026 industry benchmarks):
• Cost: $10–12 million per MW for a standard hyperscale build; $15–20 million+ per MW for AI-focused facilities requiring liquid cooling. A gigawatt-scale complex runs $45–55 billion.
• Land: A small edge facility needs 5,000–50,000 sq ft; a hyperscale campus typically needs 10+ acres and often exceeds a million square feet; AI mega-campuses need 100+ acres for phased expansion.
• Power: U.S. data centers now draw 29.2 gigawatts combined — 43% of the entire world’s data center electricity load — and used roughly 4.4% of all U.S. electricity in 2023, projected to reach 6.7–12% by 2028.
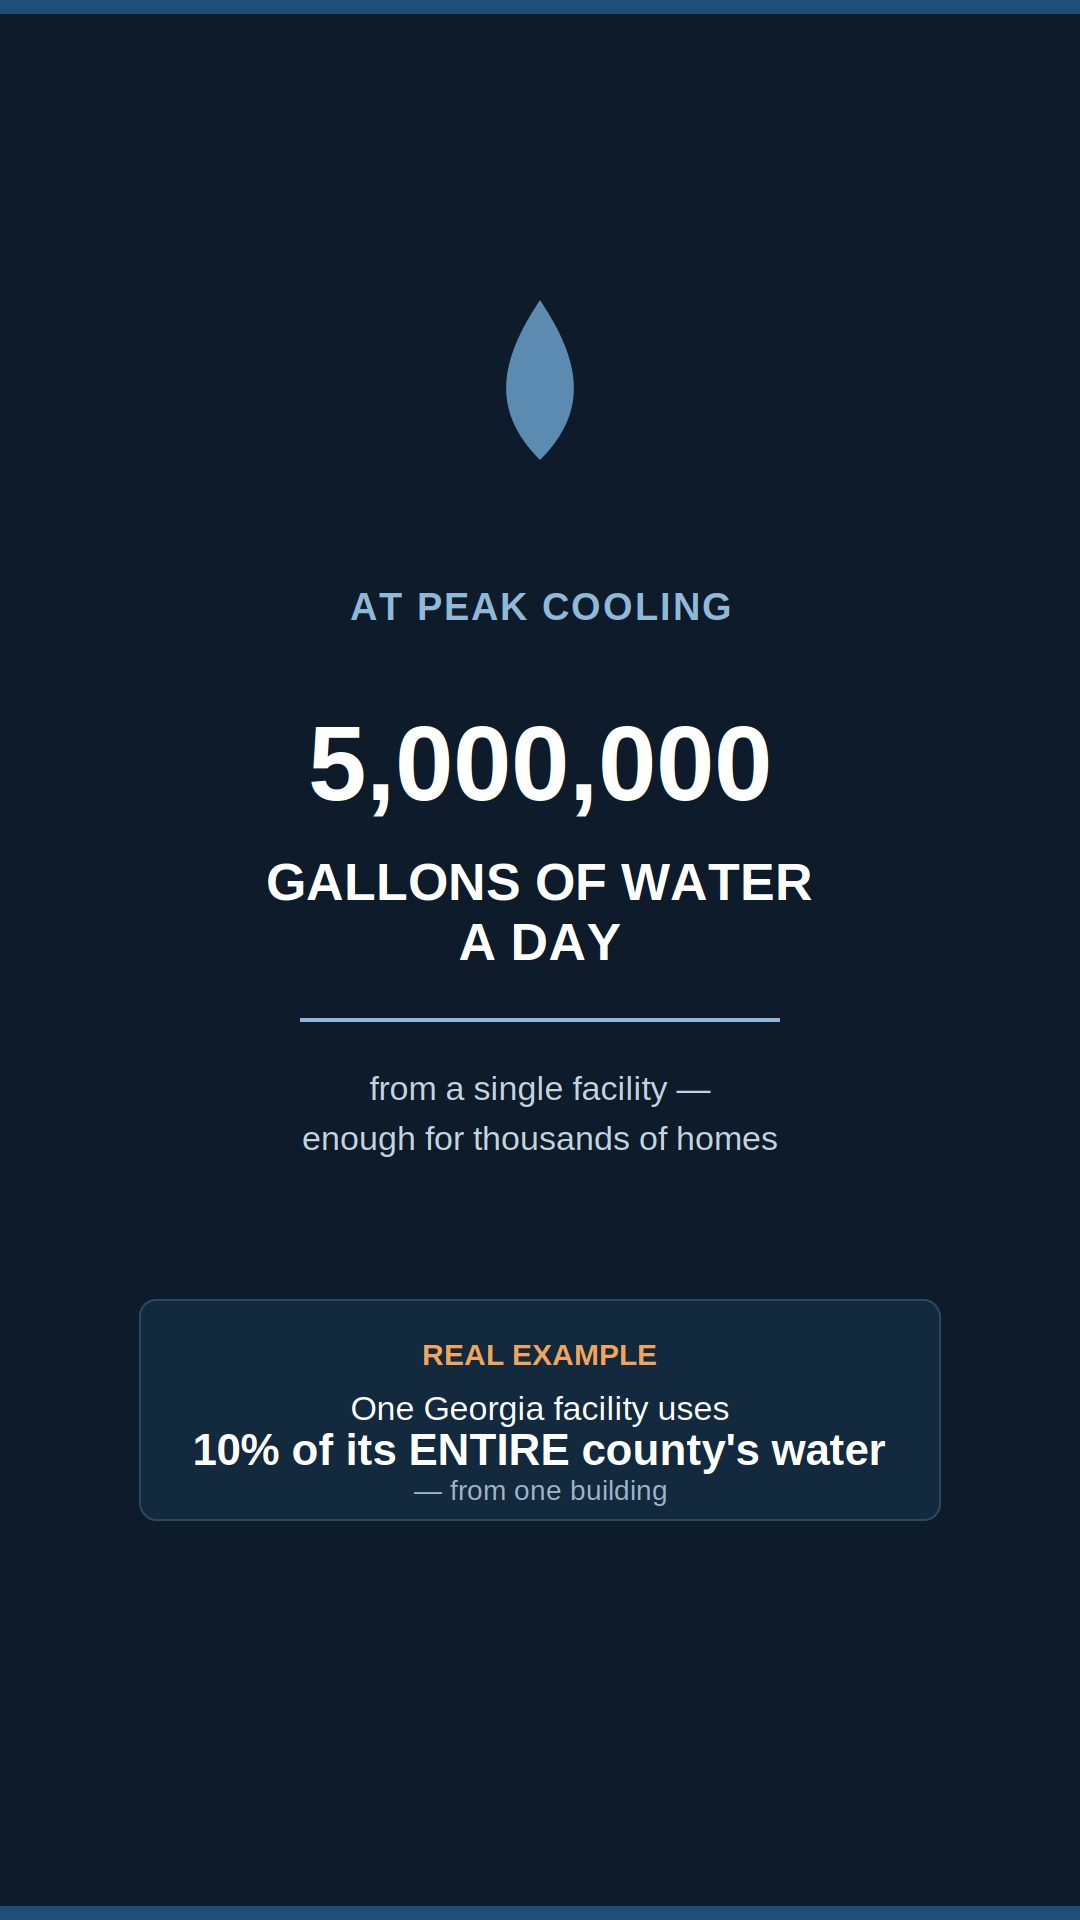
• Water: A typical mid-sized facility uses about 300,000 gallons a day — comparable to 1,000 households. A 100 MW facility can peak at up to 5 million gallons a day during hot weather, when evaporative cooling runs hardest.
The geography of where these facilities are being built is shifting fast. Historically, 87% of existing data centers sit in urban areas with established infrastructure. But 67% of newly planned facilities are headed to rural areas — and 39% of planned projects are going into counties that have never hosted a data center before. That shift is the single biggest reason opposition is spreading: it’s showing up in communities with no institutional experience negotiating with hyperscale developers, and no existing infrastructure margin to absorb the load.
The National Power Grid, In Brief
The United States does not have one power grid — it has three. The Eastern Interconnection covers everything from the Rockies to the Atlantic; the Western Interconnection covers the Pacific states and the Mountain West; and ERCOT covers most of Texas as its own, largely self-contained island, deliberately kept separate from federal interstate regulation. Within those three physical interconnections, day-to-day operations are run by regional grid operators — PJM, MISO, SPP, and SERC in the East; WECC in the West; and ERCOT in Texas — each responsible for keeping supply and demand balanced second-by-second across the states it covers.
This structure matters directly for data centers, because where a facility sits determines which grid operator has to approve its connection, how long that takes, and who ultimately answers for reliability if something goes wrong. For a deeper walkthrough of how the national grid is organized and where its stress points are, see our companion reference: National Power Grid — Threat Assessment.
The map below shows, schematically, where the three grid interconnections sit relative to one another and where today’s data-center concentration actually is. The heaviest concentrations — Virginia, Texas, and increasingly Georgia and Ohio — sit squarely inside the Eastern Interconnection, which is also the interconnection currently showing the clearest signs of strain (see the PJM shortfall and NERC alert discussed below).
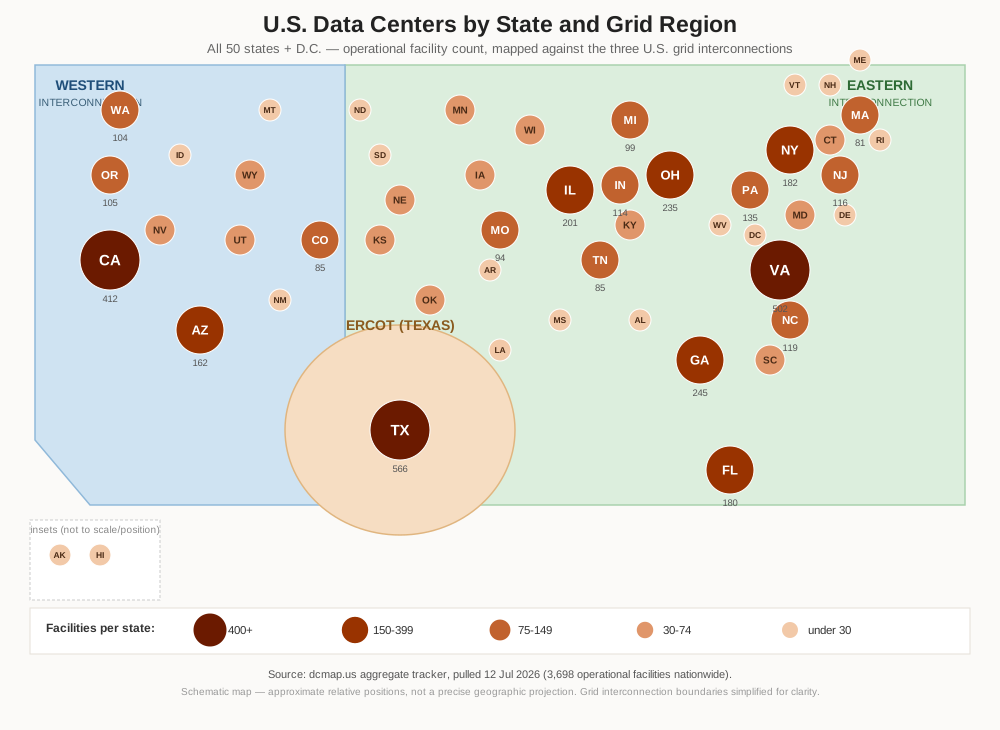
Notice the overlap: the two heaviest data-center states, Texas and Virginia, sit in two different grids with two very different regulatory postures. ERCOT operates largely outside federal interstate transmission rules, giving it faster but less externally supervised interconnection; PJM (which includes Virginia) is now under direct federal scrutiny for exactly this kind of large-load interconnection, discussed next.
How the U.S. Compares to the Rest of the World
Everything in this article so far has been about competition between American states — but it’s worth stepping back to see how dominant the U.S. position is globally. As of late 2025/2026, the United States operates more than 5,400 data centers, roughly 45% of the entire world’s total of about 12,000 facilities. That’s more than the next four countries combined: Germany (~530), the United Kingdom (~520), China (~450), and Canada (~340) put together don’t add up to half of what the U.S. has alone. No other single country comes remotely close — the gap between the U.S. and the #2 country is larger than the gap between the #2 country and #20.
Raw site count actually understates the imbalance. Because American facilities skew toward the largest hyperscale class, the U.S. controls an even larger share of the world’s actual computing capacity than its share of physical sites suggests — on the order of half of all hyperscale data center capacity worldwide, according to industry tracking from Synergy Research Group. China presents an interesting contrast: it has far fewer sites than Germany or the UK, but many of its facilities are built at massive scale specifically for AI training and domestic cloud demand, so its share of global compute capacity runs meaningfully higher than its site count alone implies.
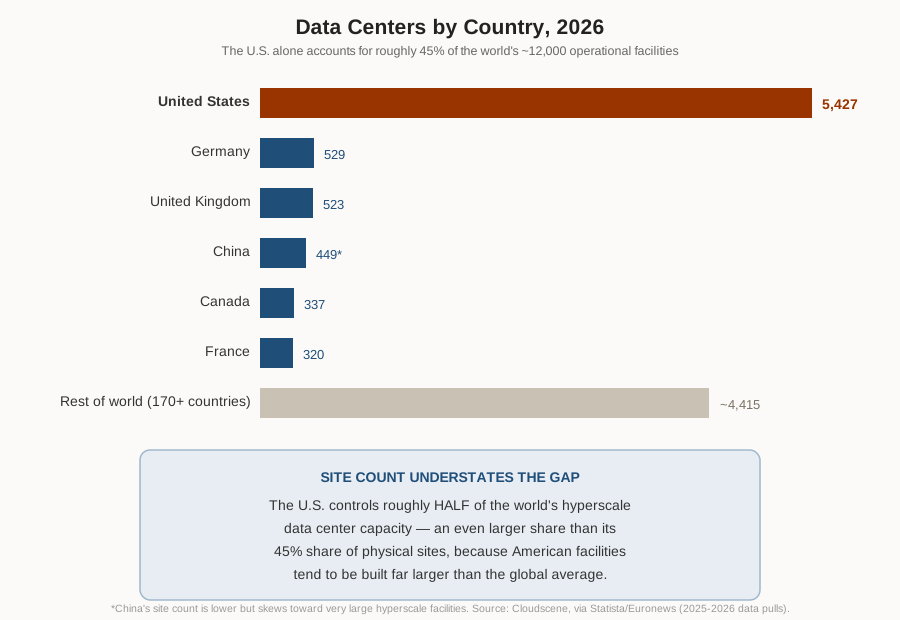
Site count is the easier number to find, but installed capacity — the actual megawatts of computing power a country has built — tells an even more lopsided story. The International Energy Agency puts global installed data center capacity at 122.2 gigawatts as of 2024. The United States alone accounts for 53.7 GW of that — 44% of the entire world’s capacity in a single country. The U.S. and China together account for 70% of global capacity, leaving the rest of the world’s 170-plus countries, including all of Europe, to split the remaining 30%.
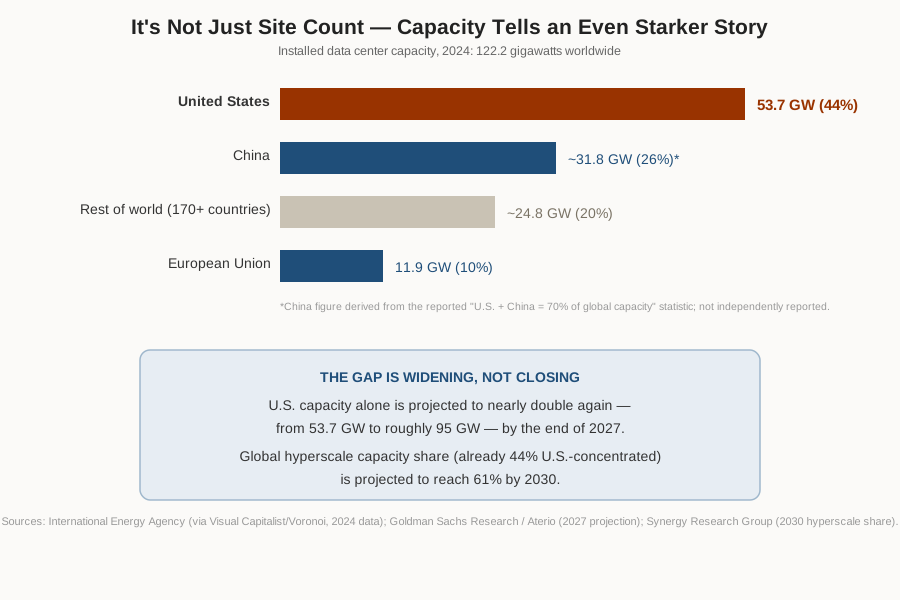
And the gap is widening, not closing. U.S. data center capacity is projected to nearly double again — from 53.7 GW to roughly 95 GW — by the end of 2027, according to Goldman Sachs Research using facility-level data from Aterio (the same source behind the state-by-state tables later in this article). Globally, hyperscale operators’ share of all data center capacity is projected to climb from 44% to 61% by 2030, and the U.S. is where the overwhelming majority of that hyperscale capacity sits.
The practical takeaway for this article: the state-by-state buildout decisions covered above aren’t just reshaping American power grids and water systems — they’re effectively steering the majority of the world’s AI and cloud computing infrastructure. A zoning vote in a Georgia county or a water-rights fight in Utah carries weight far beyond that county or that state, because so much of the planet’s digital infrastructure runs through a relatively small number of U.S. jurisdictions.
A note on this figure: the “5,400+” count here comes from Cloudscene, a global site tracker used because it counts data centers consistently across every country — necessary for a fair international comparison. It will not match the Aterio-based U.S. state figures used in the tables later in this article (which show roughly 2,000 currently operating), because the two trackers use different counting methodologies. See the full methodology note near the end of this article for more on why tracker totals vary.
The Power Grid: Two-Way Strain
Data centers stress the electric grid in two directions, and regulators are only now catching up to both.
Demand growth is outrunning supply
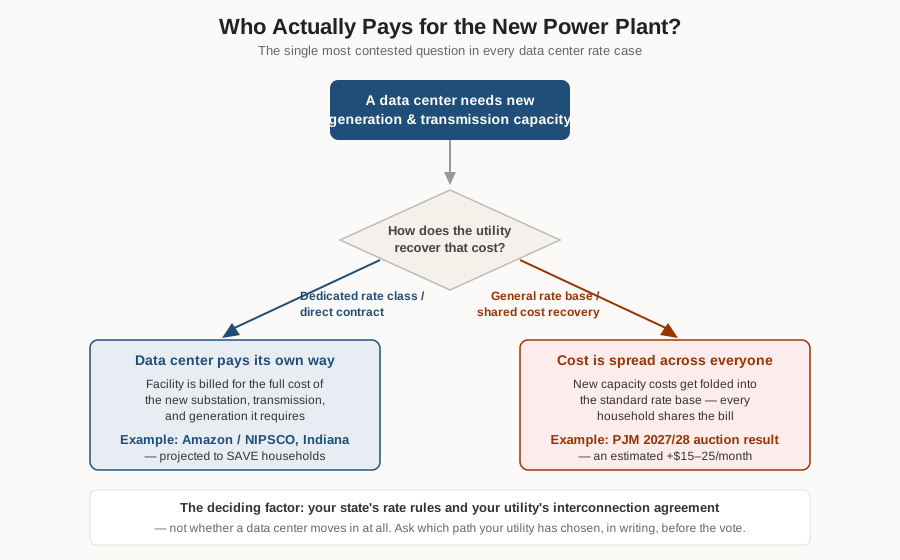
The grid operator covering 13 mid-Atlantic and Midwest states plus Washington, D.C. (PJM) failed to meet its own reliability requirement for the first time in its history in its most recent capacity auction — committing 134,747 MW against 141,370 MW required, a 6,623 MW shortfall, with roughly 5,100 MW of that increase attributable to data centers. The price that cleared the auction, $333.44 per megawatt-day, translates into an estimated $15–25 per month increase for a typical household’s electric bill starting in mid-2027 — a cost increase regulators and utilities agree is being driven largely by data-center load, even where the utilities themselves dispute how it should be characterized. The Natural Resources Defense Council projects data-center growth alone could open a 34-gigawatt deficit in the PJM region by 2032.
Sudden load loss is a newer, less understood risk
In May 2026, the North American Electric Reliability Corporation (NERC) — the entity that regulates grid reliability across the U.S. and Canada — issued only the third “Level 3” emergency alert in its 58-year history, after repeated incidents in Virginia and Texas where data-center protective circuits caused more than 1,000 MW of demand to disappear from the grid within seconds. That’s roughly equivalent to unplugging a city the size of New Orleans in under a minute — a shock the grid is engineered to absorb from a power plant failure, not from a sudden drop in demand. NERC’s seven required corrective actions carry a full-response deadline of August 3, 2026, and are expected to add 6–12 months of review time to any data-center project still in a grid interconnection queue through 2028.
What this means for other critical infrastructure
Beyond the electric bill, the grid-reliability questions above translate into real operational risk for hospitals, water treatment plants, emergency dispatch centers, and traffic systems that depend on stable regional power — all of which are designed around predictable demand patterns that large co-located data-center load can now disrupt in either direction. Utilities in power-constrained regions are increasingly requiring data-center operators to fund their own substation upgrades, dedicated transmission lines, and — in some cases — on-site backup generation, specifically so that a single large customer’s failure mode does not become a community-wide reliability event.
Not every market experiences this the same way. In areas with abundant power supply relative to demand — parts of West Texas and Indiana, for example — a single large data-center customer sharing fixed grid costs can actually lower rates for existing residents; Amazon’s Indiana project is projected to save local households roughly $1 billion over 15 years under its negotiated agreement with the utility. The outcome depends almost entirely on how the interconnection and rate agreements are structured before a shovel goes in the ground.
When a Gigawatt Load Suddenly Arrives — or Suddenly Leaves
Most infrastructure debates focus on steady-state demand: how many megawatts a facility draws once it’s up and running. But 2025 and 2026 have surfaced a second, less intuitive risk — what happens in the seconds and minutes around a large data-center load switching on, switching off, or hiccupping.
The problem regulators are now watching: sudden load loss
Grid operators are built to absorb a large power plant suddenly failing — that’s a known, modeled event. What they are not built to absorb as easily is a large customer suddenly disappearing. Data centers run internal protective circuits that, when they sense a power-quality disturbance (a voltage sag, a brief disturbance on the grid), can disconnect the facility’s load in a fraction of a second to protect their own equipment. When that happens at gigawatt scale, it can yank more than 1,000 megawatts of demand off the grid within seconds — roughly equivalent to unplugging a city the size of New Orleans in under a minute. That sudden change in demand jolts grid voltage and frequency in much the same way a large power plant tripping offline would, except the grid’s safeguards were designed for the plant scenario, not the demand scenario.
This is not a hypothetical: it has already happened multiple times in the eastern U.S. and in Texas. It’s serious enough that in May 2026, the North American Electric Reliability Corporation (NERC) — the entity that sets and enforces grid reliability rules across the U.S. and Canada — issued only the third “Level 3” emergency alert in its 58-year history specifically because of this pattern. The alert requires grid operators to rebuild how they model, monitor, and test large data-center loads before those loads are allowed to connect, with a full compliance deadline of August 3, 2026.
The mirror-image problem: sudden onboarding and inrush
The reverse event — a large facility switching on, or its backup systems kicking in — carries its own, more familiar strain. Large electrical loads draw a brief “inrush” current well above their steady-state draw the moment they energize, similar to (but far larger than) the flicker you might notice when a home air conditioner compressor kicks on. At data-center scale, utilities require staged, carefully sequenced start-up procedures — bringing cooling and IT load online in planned increments rather than all at once — specifically to avoid destabilizing the local distribution grid. This is also why data centers maintain large banks of backup diesel generators and, increasingly, battery or flywheel systems: not just for outage protection, but to manage the facility’s own transition on and off grid power without sending a shock through the system either way.
What this means locally
For host communities, the practical implication is that a data center’s impact on grid stability isn’t fully captured by its megawatt rating alone. Two facilities of identical size can pose very different reliability risks depending on how their protective systems are configured and tested, and how carefully the interconnection agreement accounts for both sudden loss and sudden start-up scenarios. This is now a standard, and increasingly non-negotiable, item that grid operators require before approving new large-load connections — and it is expected to add six to twelve months of review time to projects still in the interconnection queue through 2028.
Water: The Constraint Nobody Budgets For Until It’s Too Late
Water gets far less attention than electricity in the data-center debate, but it is often the harder constraint to solve, because unlike power lines, water systems can’t easily be expanded by writing a bigger check to a utility — the physical supply itself is often already fully allocated.
The Newton County, Georgia case has become the industry’s cautionary tale. A Meta data center that opened there in 2018 consumes 500,000 gallons of water a day — 10% of the entire county’s water consumption, from one building. The county is now fielding additional permit requests for facilities that would each use up to 6 million gallons a day — enough, on their own, to more than double the county’s total current water draw. Similar dynamics are now emerging in Mason County, WA; Carroll County, GA; and Loudoun County, VA.
Nationally, a March 2026 UC Riverside study estimated the U.S. will need between 697 million and 1.45 billion gallons per day of new peak water capacity by 2030 to support data-center growth — roughly equivalent to adding another New York City’s entire daily water supply. Even with optimistic annual efficiency gains, the study still projects a 227–604 million gallon-per-day gap. Building that new capacity would cost $10–58 billion, on top of the trillions the EPA already says the nation’s water and sewer systems need for basic upgrades.
In the Western United States, where water rights are allocated by seniority of claim rather than by adjacency, this becomes a legal as well as an infrastructure problem: a data center holding a senior water right can, in a drought, take priority over a household with a newer claim. Utah’s HB 60 (effective May 2026) narrowed the state’s water regulator to reviewing only water-specific impacts, removing broader public-welfare grounds for objection — a template water-policy analysts expect Wyoming, Nevada, Arizona, and Idaho to consider adopting as they compete for the same projects.
Newer closed-loop and immersion cooling systems can cut freshwater use by up to 70% compared to the evaporative cooling still standard in most existing buildings — but retrofitting an operating facility takes years and significant capital, so the technology won’t close the gap at the pace the industry is growing.
Side by Side: A 100 MW Data Center vs. a Town of 80,000 People
Numbers like “100 megawatts” or “500,000 gallons a day” are hard to picture in isolation. The comparison that actually lands with most residents is a direct one: how does a single mid-size hyperscale facility compare to a town or small city of a similar population footprint on the grid and water system?
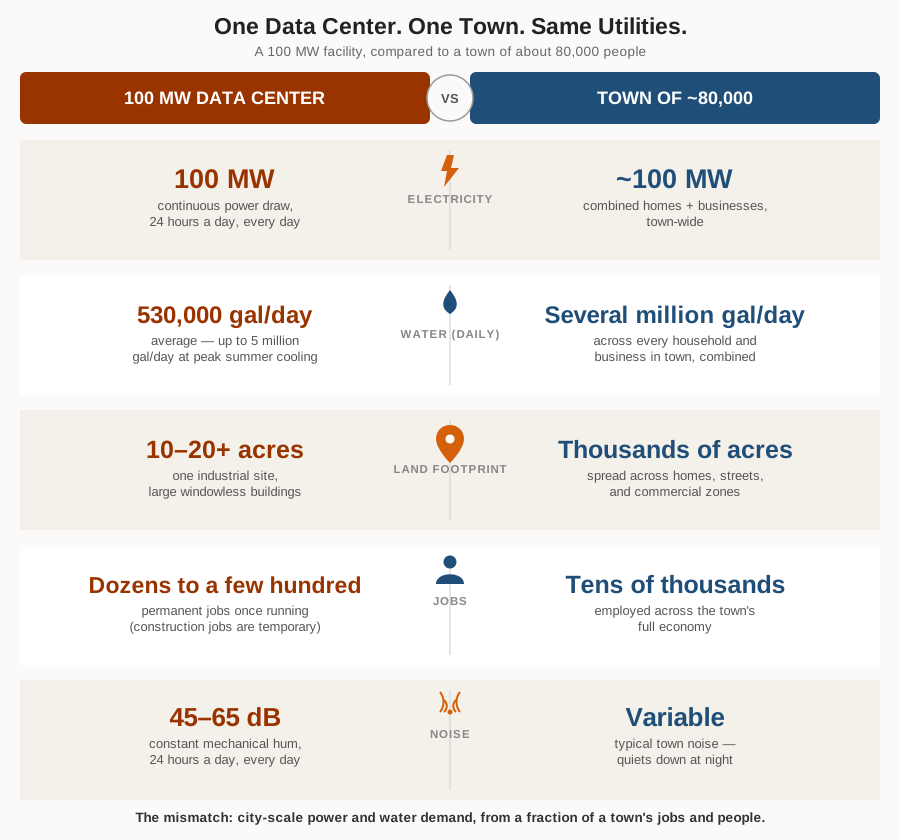
The comparison isn’t meant to say a data center is “as big as” a town in every sense — it employs far fewer people and covers far less land. The point is narrower and more useful: on the two things that actually strain shared infrastructure, power and water, a single facility can rival or exceed what an entire town of tens of thousands of people needs, while bringing a small fraction of that town’s population, workforce, and day-to-day economic activity. That mismatch — city-scale utility demand from a facility with a town-fraction of jobs and residents — is the structural reason these projects generate outsized local debate relative to their footprint.
What Residents Actually Experience
Set aside the regional grid and water statistics for a moment — what does living near one of these facilities actually feel and look like?
Constant low-frequency noise. Cooling equipment and backup generators run 24/7. Residents in Loudoun County, VA, Prince William County, VA, and other established data-center corridors have described a persistent hum and, in some cases, low-frequency vibration strong enough to be felt inside nearby homes — one Virginia resident reported having to move a newborn’s crib to the basement to escape it.
Years of construction disruption. Buildout phases bring sustained heavy-truck traffic, road wear, and multi-year construction timelines, particularly where several campuses cluster in the same corridor.
Land-use and character change. Many proposed sites are former agricultural or forested land. The buildings themselves are large, largely windowless industrial structures — a stark visual change for communities used to open land.
Property values — a more mixed picture than assumed. The dominant public fear is that a nearby data center depresses home values. Recent analysis of Northern Virginia’s mature data-center market — the most data-rich test case in the country — suggests that fear does not consistently hold up; assessed values in some established corridors have held or risen, likely reflecting the substantial tax base and infrastructure investment data centers bring. The picture is far less clear for newer, rural sites still in their construction or early-operation phase, where noise, traffic, and visual impact are freshest.
Jobs — real, but concentrated in construction. Estimates suggest the current pipeline of roughly 2,800 announced or under-construction U.S. facilities could generate 4.7 million temporary construction jobs nationally, alongside a projected shortage of nearly 500,000 skilled trade workers by 2027. But once a facility is operational, permanent on-site staffing is typically small relative to the scale of the building — critics argue this is the central mismatch between the incentives localities offer and the jobs actually created.
Tax base — often the strongest argument in favor. Data centers frequently represent an unusually high assessed value relative to their physical footprint, and in many jurisdictions that tax revenue materially funds schools, fire protection, libraries, and road maintenance — one of the few durable, ongoing local benefits once the construction jobs move on. Whether that revenue offsets the true infrastructure cost, or whether tax abatement deals give too much of it away, is the central fight in nearly every siting debate.
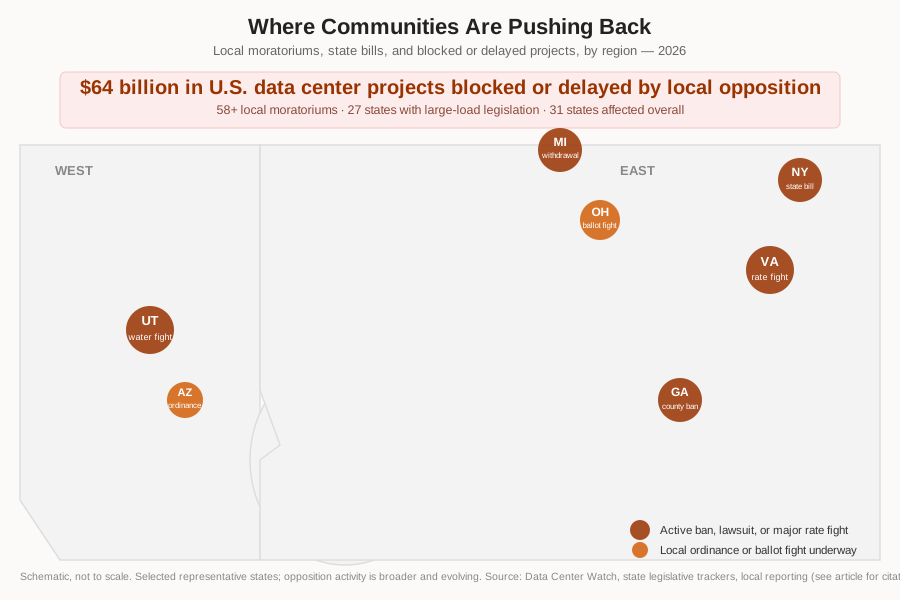
The bottom line for residents: the concerns cross party lines in a way few infrastructure fights do. Data Center Watch estimates roughly $64 billion in U.S. data-center projects have been blocked or delayed by local opposition to date, with conservative officials typically focused on grid strain and tax giveaways, and progressive officials typically focused on water and environmental impact — landing in the same place from different directions.
How Loud Is a Data Center, Really?
Noise is measured in decibels (dB) on a logarithmic scale — a 10 dB increase sounds roughly twice as loud to the human ear, not just “a bit more.” Local noise ordinances typically cap continuous noise at a residential property line around 55–65 dB during the day and 45–55 dB at night. Here is where data centers actually fall against everyday, familiar sounds.

A well-designed, well-sited modern data center typically operates in the 45–55 dB range at the property line — quieter than a normal conversation, similar to a running refrigerator. That’s the industry’s own benchmark for what “done right” looks like. But field measurements at facilities that draw documented complaints — including cases in Virginia, Arizona, Michigan, and Texas — regularly run 55–65 dB, and unmitigated or poorly-sited facilities have measured as high as 85 dB nearby. Three things make the number misleading on its own: the noise is constant, 24 hours a day, every day; it’s dominated by low-frequency hum (in the 63–250 Hz range) that standard decibel meters under-report but that travels farther and penetrates walls and windows more easily than higher-pitched sound; and backup generator load tests — usually monthly, and generally exempt from noise ordinances as emergency equipment — can be heard up to a mile away and register close to 105 dB near the source.
The most effective community protection isn’t a single decibel cap — it’s a binding pre-construction noise study, a defined testing schedule for generators with advance neighbor notice, and mandatory post-construction verification with a real remedy if measured noise exceeds what was modeled. Chandler, Arizona adopted the first ordinance built around exactly that model after years of resident complaints about a facility’s chiller fans.
The Other Utility: Fiber, Not Just Power and Water
Power and water get most of the public attention, but a data center is fundamentally useless without a third utility: massive amounts of fiber-optic connectivity, both inside the building and running out to the rest of the internet. This is the infrastructure layer most residents never see, because it’s buried in the ground — but it is just as much a driver of where these facilities get sited as cheap power.
Inside the building: fiber density has exploded
AI-focused data centers require roughly ten times more optical fiber in the same physical space as a conventional server room. A single rack of modern AI processors can require more than 800 individual fiber connections; scale that to a 100-rack cluster and a facility needs on the order of 86,000 individual fibers for internal rack connectivity alone, before counting the fiber needed to connect one building to the next on the same campus. Connecting all the buildings on a single large campus together can require fiber counts surpassing 10,000 strands. This is a genuinely new engineering problem: cable pathways designed for a conventional data center a decade ago simply cannot physically accommodate the fiber density an AI cluster now needs, which is why older facilities being retrofitted for AI workloads often require significant and disruptive construction just to expand their internal cabling infrastructure.
Outside the building: the “middle mile” race
Every data center also needs to connect outward — to internet exchange points, to cloud provider backbones, and increasingly directly to other data centers for AI training workloads split across multiple sites. Industry estimates project the U.S. will need to nearly double its inter-facility fiber route mileage, from roughly 95,000 to 187,000 miles, by 2029 just to keep pace with data-center growth. Corning and Meta alone have signed a multi-year agreement worth up to $6 billion specifically to accelerate this kind of fiber buildout. For rural communities newly hosting a data center, this can be a genuine secondary benefit: fiber laid to serve the facility sometimes passes near, or can be tapped to extend service to, homes and businesses that previously had no broadband access at all — though this outcome depends entirely on whether the developer and local utility negotiate shared-use terms into the build, and is not automatic.
Latency and redundancy
Distance still matters even at the speed of light: data traveling through fiber moves at roughly two-thirds the speed of light in a vacuum, so a facility’s physical location relative to major population centers and other data centers directly affects how “responsive” the services running inside it feel to end users. This is why data centers serving real-time applications cluster near existing fiber hubs and metro areas, while facilities built purely for AI model training — which is less sensitive to latency — have more geographic freedom to locate near cheap power and land instead. Because a severed fiber line (from construction accidents, natural disasters, or aging infrastructure) can take an entire facility offline for its external connectivity even while power stays on, hyperscale operators typically require multiple physically diverse fiber routes into any new site — another item, alongside power and water, that shows up in a serious site-selection review.
Where This Is Headed
Every figure in this article represents a snapshot of a rapidly moving target. The most useful question for any community isn’t “how big is the problem today” — it’s “how much bigger will it be by the time a proposal actually breaks ground,” given that a project typically takes two to three years from announcement to energization.

U.S. data centers used about 4.4% of all national electricity in 2023, and roughly 6% by mid-2026. Federal projections put the 2028 figure between 6.7% and 12%, with 9% as the working middle estimate. To make the top of that range concrete: adding roughly 3–4 percentage points of national electricity demand in five years is comparable to adding the entire combined electricity demand of California and Texas onto the national grid over the same period. NERC separately projects summer peak grid demand will rise 24% over the next decade — and neither new power generation nor new transmission capacity is being built fast enough to keep pace, largely because of the equipment lead times described earlier in this article.
The financial commitments behind that growth are enormous and still accelerating. The top four hyperscale cloud providers — Amazon, Microsoft, Google, and Meta — are collectively expected to spend approximately $700 billion on data-center infrastructure in the U.S. in 2026 alone, part of a global 2026 total approaching $1 trillion. Morgan Stanley projects hyperscaler borrowing to exceed $400 billion in 2026 to help fund it. Looking further out, McKinsey projects $7 trillion in global data-center capital spending through 2030, with more than 40% of that landing in the United States and roughly 70% coming from the four hyperscalers. JPMorgan puts the global figure as high as $5 trillion this decade when AI infrastructure spending is included more broadly.
That capital is not converting into finished, energized capacity at anywhere near the same pace. Of roughly 12 gigawatts of AI computing capacity announced for completion in 2026, only about 5 gigawatts are actually under active construction — the rest is delayed or effectively stalled, overwhelmingly because of the transformer and switchgear lead times discussed elsewhere in this piece. The practical lesson for any community: an impressive capital announcement is not a commitment that a project will be built on the announced timeline, or built at all. The gap between an announcement and an energized, operating facility is now routinely six to eighteen months and growing.
Table 1 — U.S. Data Centers by State: Operating, Under Construction & Planned
Data pulled: 12 July 2026. Source: Aterio US Data Center Inventory. All 50 states plus D.C., ranked by number of currently operating facilities.
| Rank | State | Operating | Under Construction | Planned / Announced | Total Pipeline |
|---|---|---|---|---|---|
| 1 | Virginia | 329 | 142 | 512 | 983 |
| 2 | Texas | 229 | 152 | 757 | 1,138 |
| 3 | California | 167 | 8 | 47 | 222 |
| 4 | Ohio | 112 | 66 | 169 | 347 |
| 5 | Oregon | 100 | 11 | 34 | 145 |
| 6 | Arizona | 85 | 34 | 147 | 266 |
| 7 | Illinois | 79 | 22 | 167 | 268 |
| 8 | Washington | 70 | 4 | 27 | 101 |
| 9 | Georgia | 68 | 58 | 355 | 481 |
| 10 | Iowa | 61 | 13 | 39 | 113 |
| 11 | Florida | 54 | 1 | 36 | 91 |
| 12 | New York | 50 | 5 | 73 | 128 |
| 13 | New Jersey | 49 | 3 | 10 | 62 |
| 14 | North Carolina | 44 | 13 | 48 | 105 |
| 15 | Pennsylvania | 38 | 15 | 240 | 293 |
| 16 | Indiana | 33 | 25 | 119 | 177 |
| 17 | Tennessee | 32 | 5 | 6 | 43 |
| 18 | Michigan | 31 | 2 | 22 | 55 |
| 19 | Colorado | 31 | 6 | 11 | 48 |
| 20 | Utah | 30 | 7 | 188 | 225 |
| 21 | Minnesota | 28 | 3 | 45 | 76 |
| 22 | Nevada | 27 | 29 | 82 | 138 |
| 23 | Nebraska | 27 | 5 | 8 | 40 |
| 24 | Missouri | 26 | 15 | 69 | 110 |
| 25 | Massachusetts | 23 | 0 | 0 | 23 |
| 26 | Oklahoma | 22 | 13 | 52 | 87 |
| 27 | South Carolina | 18 | 11 | 15 | 44 |
| 28 | Wisconsin | 18 | 14 | 33 | 65 |
| 29 | Alabama | 16 | 7 | 40 | 63 |
| 30 | New Mexico | 13 | 7 | 50 | 70 |
| 31 | Wyoming | 12 | 12 | 24 | 48 |
| 32 | Kentucky | 12 | 3 | 53 | 68 |
| 33 | Maryland | 12 | 12 | 19 | 43 |
| 34 | Mississippi | 10 | 23 | 22 | 55 |
| 35 | Louisiana | 10 | 13 | 16 | 39 |
| 36 | Kansas | 8 | 3 | 32 | 43 |
| 37 | Connecticut | 7 | 0 | 33 | 40 |
| 38 | New Hampshire | 6 | 0 | 0 | 6 |
| 39 | District of Columbia | 6 | 0 | 0 | 6 |
| 40 | Delaware | 6 | 0 | 3 | 9 |
| 41 | Idaho | 6 | 2 | 6 | 14 |
| 42 | West Virginia | 4 | 0 | 40 | 44 |
| 43 | Arkansas | 4 | 3 | 22 | 29 |
| 44 | Montana | 4 | 0 | 11 | 15 |
| 45 | Maine | 4 | 0 | 7 | 11 |
| 46 | Rhode Island | 3 | 0 | 0 | 3 |
| 47 | South Dakota | 2 | 0 | 7 | 9 |
| 48 | North Dakota | 2 | 4 | 15 | 21 |
| 49 | Hawaii | 2 | 0 | 0 | 2 |
| 50 | Vermont | 1 | 0 | 0 | 1 |
| 51 | Alaska | 0 | 0 | 4 | 4 |
| U.S. TOTAL | 2,031 | 771 | 3,715 | 6,517 | |
Note the pattern: Texas and Georgia both carry more announced/planned capacity than they have operating today (Texas 757 announced vs. 229 operating; Georgia 355 announced vs. 68 operating) — meaning both states’ data center footprints could roughly triple to quintuple if every announced project is actually built. Virginia, by contrast, already has the deepest operating base (329) and the most under-construction (142), reflecting its two-decade head start as the industry’s original hub.
Different trackers use different methodologies and will not agree exactly — this table uses a single source (Aterio) throughout for internal consistency between the operating/under-construction/planned columns. Figures elsewhere in this article citing dcmap.us or Pew Research may show different totals for the same states; see the methodology note near the end of this article.
Table 2 — U.S. Data Centers by State: Ranked by Planned / Announced
Data pulled: 12 July 2026. Source: Aterio US Data Center Inventory. All 50 states plus D.C., ranked by number of announced/planned facilities — the clearest signal of where the next wave of construction is headed.
| Rank | State | Operating | Under Construction | Planned / Announced | Total Pipeline |
|---|---|---|---|---|---|
| 1 | Texas | 229 | 152 | 757 | 1,138 |
| 2 | Virginia | 329 | 142 | 512 | 983 |
| 3 | Georgia | 68 | 58 | 355 | 481 |
| 4 | Pennsylvania | 38 | 15 | 240 | 293 |
| 5 | Utah | 30 | 7 | 188 | 225 |
| 6 | Ohio | 112 | 66 | 169 | 347 |
| 7 | Illinois | 79 | 22 | 167 | 268 |
| 8 | Arizona | 85 | 34 | 147 | 266 |
| 9 | Indiana | 33 | 25 | 119 | 177 |
| 10 | Nevada | 27 | 29 | 82 | 138 |
| 11 | New York | 50 | 5 | 73 | 128 |
| 12 | Missouri | 26 | 15 | 69 | 110 |
| 13 | Kentucky | 12 | 3 | 53 | 68 |
| 14 | Oklahoma | 22 | 13 | 52 | 87 |
| 15 | New Mexico | 13 | 7 | 50 | 70 |
| 16 | North Carolina | 44 | 13 | 48 | 105 |
| 17 | California | 167 | 8 | 47 | 222 |
| 18 | Minnesota | 28 | 3 | 45 | 76 |
| 19 | Alabama | 16 | 7 | 40 | 63 |
| 20 | West Virginia | 4 | 0 | 40 | 44 |
| 21 | Iowa | 61 | 13 | 39 | 113 |
| 22 | Florida | 54 | 1 | 36 | 91 |
| 23 | Oregon | 100 | 11 | 34 | 145 |
| 24 | Wisconsin | 18 | 14 | 33 | 65 |
| 25 | Connecticut | 7 | 0 | 33 | 40 |
| 26 | Kansas | 8 | 3 | 32 | 43 |
| 27 | Washington | 70 | 4 | 27 | 101 |
| 28 | Wyoming | 12 | 12 | 24 | 48 |
| 29 | Michigan | 31 | 2 | 22 | 55 |
| 30 | Mississippi | 10 | 23 | 22 | 55 |
| 31 | Arkansas | 4 | 3 | 22 | 29 |
| 32 | Maryland | 12 | 12 | 19 | 43 |
| 33 | Louisiana | 10 | 13 | 16 | 39 |
| 34 | South Carolina | 18 | 11 | 15 | 44 |
| 35 | North Dakota | 2 | 4 | 15 | 21 |
| 36 | Colorado | 31 | 6 | 11 | 48 |
| 37 | Montana | 4 | 0 | 11 | 15 |
| 38 | New Jersey | 49 | 3 | 10 | 62 |
| 39 | Nebraska | 27 | 5 | 8 | 40 |
| 40 | Maine | 4 | 0 | 7 | 11 |
| 41 | South Dakota | 2 | 0 | 7 | 9 |
| 42 | Tennessee | 32 | 5 | 6 | 43 |
| 43 | Idaho | 6 | 2 | 6 | 14 |
| 44 | Alaska | 0 | 0 | 4 | 4 |
| 45 | Delaware | 6 | 0 | 3 | 9 |
| 46 | Massachusetts | 23 | 0 | 0 | 23 |
| 47 | New Hampshire | 6 | 0 | 0 | 6 |
| 48 | District of Columbia | 6 | 0 | 0 | 6 |
| 49 | Rhode Island | 3 | 0 | 0 | 3 |
| 50 | Hawaii | 2 | 0 | 0 | 2 |
| 51 | Vermont | 1 | 0 | 0 | 1 |
| U.S. TOTAL | 2,031 | 771 | 3,715 | 6,517 | |
Two things stand out once every state is visible rather than just the top few:
• The pipeline is heavily concentrated but not confined to familiar names. Texas (757 announced) and Virginia (512) dominate, but Georgia (355), Pennsylvania (240), and Utah (188) all carry substantial announced pipelines relative to how little they currently have operating — meaning the geography of “data center states” looks very different in five years than it does today.
• Several states with near-zero footprint today have real projects announced. Wyoming (24 announced against just 12 operating), Kentucky (53 announced against 12 operating), and West Virginia (40 announced against 4 operating) are all in line for buildouts that would multiply their current footprint several times over — the “39% of planned data centers going to counties with none today” statistic cited earlier in this article, made concrete at the state level.
Same source and methodology as Table 1 (Aterio, pulled 12 July 2026) for internal consistency. A state showing low or zero counts here reflects the state of the announced pipeline as of this pull date, not an assumption that no activity is occurring — announcements are added continuously and this table will shift accordingly.
What You Should Know, What You Should Ask
A practical guide for anyone attending a local council or zoning meeting about a proposed data center
You don’t need to be an engineer or a lawyer to ask the questions that actually matter at a zoning hearing or council meeting. Most of the decisive information — water permits, interconnection status, tax agreements — is a matter of public record if you know what to ask for and where to look. The goal isn’t to block every project; it’s to make sure your community gets the terms in writing before construction starts, not after.
Before the Meeting: What to Find Out
A little homework before you show up puts you in a stronger position than any question you could ask cold. Try to find out:
• Has the developer filed for water rights or a water use permit? These filings are usually public records at your state water authority or county clerk’s office, and they often reveal the actual peak water demand before the developer states it publicly.
• Is there an existing interconnection agreement with the utility? Utilities and grid operators (like PJM, MISO, or ERCOT depending on your region) maintain public interconnection queues. A project already deep in that queue is further along than a “just proposing to the council” framing might suggest.
• Has your state or county passed any large-load legislation? By mid-2026, roughly 27 states have some form of data-center-specific rate or siting legislation. Knowing whether yours is one of them tells you what leverage your council actually has.
• Is a tax abatement or PILOT (payment in lieu of taxes) agreement being negotiated? These are usually separate from the zoning vote itself and may be negotiated by a different body (an economic development authority, not the council) — ask specifically who controls that agreement and whether it’s public yet.
Questions to Ask, By Topic
On power:
• Will this facility be billed under a dedicated rate class, or will its infrastructure costs be spread across the general rate base — meaning everyone’s bill goes up?
• Who pays for new substations, transmission lines, or generation capacity this facility requires — the developer, or ratepayers?
• Has the utility disclosed how this project affects the region’s grid reliability margin, especially during summer peak demand?
On water:
• What is the facility’s peak daily water use, not just its average — and where specifically does that water come from?
• Does the facility hold a senior or junior water right relative to existing agricultural and residential users? In a drought, who gets cut off first?
• Is the facility using evaporative cooling (higher water use) or closed-loop/liquid cooling (lower water use, higher upfront cost)? Ask which, specifically — “efficient cooling” alone is not an answer.
On noise:
• Has an independent, pre-construction noise study been conducted and made public — not just an internal developer estimate?
• What is the projected noise level at the nearest residential property line, in decibels, both day and night?
• What is the backup generator testing schedule, and will neighbors be notified in advance?
• Is there a binding post-construction noise verification requirement, with a real remedy (not just a warning) if measured noise exceeds what was modeled?
On jobs and taxes:
• How many permanent (not construction) jobs will this facility create, specifically — and what is the average wage?
• What is the length and value of any tax abatement, and what does the community actually receive in exchange?
• Is there a local-hire or local-contractor commitment for the construction phase, and is it enforceable?
On construction and long-term commitments:
• What is the expected construction timeline, and what road, traffic, or infrastructure impacts come with it?
• What happens to the site if the facility closes or is never fully built out — is there a decommissioning bond or plan?
• Are the terms discussed tonight legally binding conditions of approval, or non-binding statements of intent?
Red Flags Worth Noticing
• Vague answers on water source or noise level — “we’ll conduct a study after approval” instead of before.
• Pressure to vote quickly, or framing that treats questions as obstruction rather than due diligence.
• Non-disclosure terms that prevent the tax agreement or interconnection terms from being made public.
• Promises made verbally at the podium that don’t appear anywhere in the written conditions of approval.
The one-sentence version
If it isn’t written into the binding conditions of approval — the rate class, the water source, the noise limit, the jobs commitment, the decommissioning plan — it isn’t a commitment. It’s a pitch. Ask for it in writing before the vote, not after.
A Note on the Numbers
Public data-center trackers disagree with each other by 25–50% on how many facilities are operating or planned in the U.S., because each one defines “data center” differently — some count individual buildings, others count campuses; some remove canceled or dormant projects aggressively, others don’t. The figures in the tables above represent the best available cross-referenced snapshot as of 12 July 2026, drawn primarily from dcmap.us, Pew Research Center’s analysis of Data Center Map, and Aterio’s pipeline tracker. Readers using these numbers for planning or advocacy purposes should treat single-source totals as directional rather than precise, and should verify current figures against a live tracker before relying on them for a specific local decision.
The Question Every Community Ends Up Asking
Nearly every jurisdiction that has gone through a data-center siting fight arrives at the same three questions, usually too late to ask them before the zoning vote:
- At full build-out, what share of our county’s current electricity and water use will this facility represent — and who pays for the new capacity it requires?
- Will the facility be billed in its own rate category, with generation and infrastructure costs charged directly to it, or will those costs be spread across every resident’s utility bill?
- What is written and binding — not verbally promised — about jobs, tax revenue, water rights, noise limits, and decommissioning, before construction begins?
Data centers are not going away — they are the physical infrastructure behind every cloud service, streaming platform, and AI tool in daily use, and the U.S. buildout is accelerating, not slowing. The evidence so far suggests the outcome for any given community depends far less on whether a data center arrives than on the specific terms negotiated before it does.
Free Download
Bring This to Your Next Council Meeting
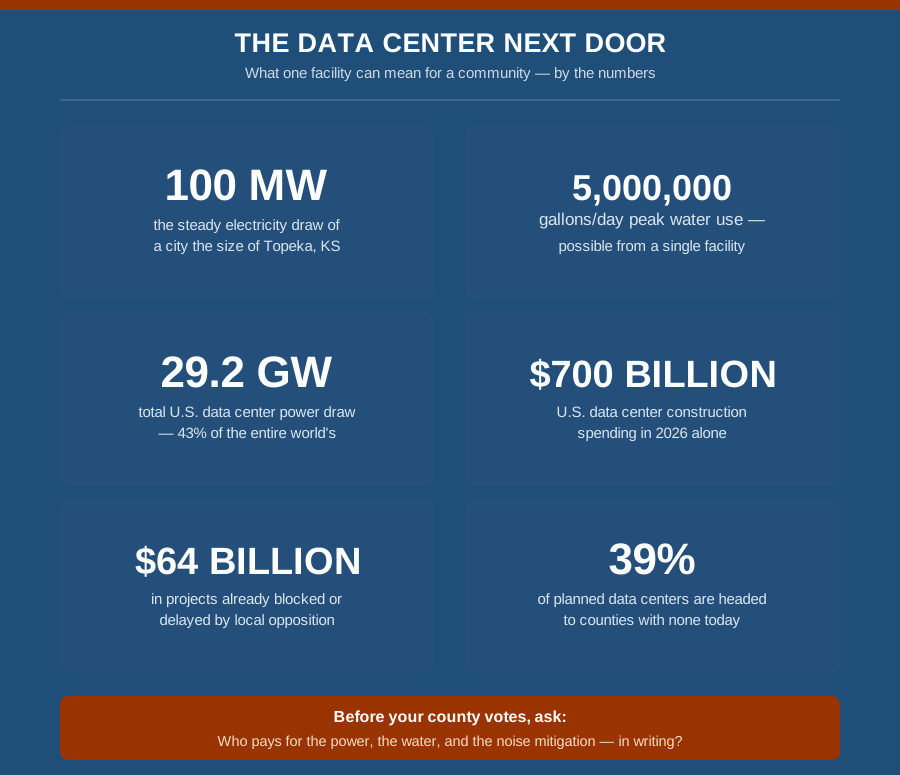
A free, print-ready 2-page guide covering everything above: the questions to ask by topic, common developer claims vs. what the data actually shows, and five real-world precedents you can cite — ready to print and carry to a zoning hearing or planning meeting.
↓ Download the Meeting Guide (PDF)
Semper Paratus, Semper Gumby.
Preparedness · Continuity · Resilience · Intelligence
Fortune Favors the Prepared