Threat Assessment Pillar
Cascade Effects and the Perfect Storm
How Small Disruptions Become Systemic Failures
This Page Serves Two Readers
The Prepared Person, Household, or MAG Emergency Management Practitioners
Who This Page Is For
This page has two readers, side by side.
The prepared person, household, or mutual assistance group. You are trying to understand what an event in the news means for your kitchen, your fuel tank, your medications, your communications, and your job. You need a framework for deciding when to act before the rest of the neighborhood notices.
The emergency manager or continuity practitioner. You are trying to translate an event into operational impact, lifeline status, and a defensible decision to elevate posture or activate a plan. You need a framework that maps cascade mechanics onto the FEMA Community Lifelines and onto your incident command structure.
Both readers are looking at the same event. The questions diverge. This page answers both sets.
Why This Matters
Modern critical infrastructure runs at 80 to 90 percent of capacity by design. Just-in-time supply chains, single-source manufacturing, and consolidated cloud and cybersecurity vendors deliver efficiency in blue sky conditions and concentrate risk in everything else. A failure in one node does not stay in that node. It propagates outward through dependencies the operator never mapped and the consumer never sees.
The discipline of cascade analysis is the discipline of asking the next question. Not what happened, but what does this enable, accelerate, or expose. The frameworks below are the vocabulary; the case studies show the mechanics; the indicators tell you what to watch for on your own watch floor or in your own kitchen.
The Six Effect Types
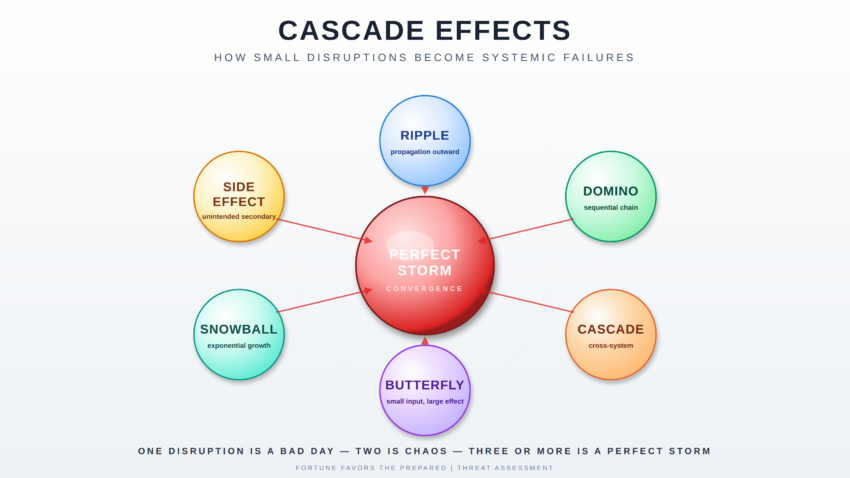
Cascading failures are not a single phenomenon. They are six related mechanisms that frequently combine. Naming them correctly is the first step to seeing them clearly.
Ripple Effect
An initial disturbance to a system that propagates outward, producing unintended impacts on increasingly larger portions of the system. Merriam-Webster
A ripple is the simplest case. A pebble enters the pond; the wave moves outward in concentric rings; the energy dissipates with distance. Most localized disruptions behave this way.
Domino Effect
A cumulative effect produced when one event sets off a chain of similar events. Merriam-Webster
Dominoes require sequence and contact. Event A topples Event B which topples Event C. Each event is roughly the same magnitude as the last. The chain stops when it runs out of dominoes or hits a gap.
Cascade Effect
An unavoidable chain of events triggered by an act affecting a system, often unforeseen.
A cascade is broader than a domino. It crosses system boundaries. The triggering event in one sector produces secondary failures in unrelated sectors that share a dependency the operator did not see. Cascades are what make modern critical infrastructure dangerous.
Butterfly Effect
Sensitive dependence on initial conditions, in which a small change in one state of the system can produce large differences in a later state. Merriam-Webster
The butterfly is the planning principle: a one-degree heading error departing Los Angeles puts you 42 miles off course at Washington Dulles. Small inputs, far-downstream consequences. The butterfly is why early warning matters.
Snowball Effect
A situation in which one action or event causes many other similar actions or events, building on itself and increasing exponentially as it travels. Merriam-Webster
The snowball grows because it gathers mass as it rolls. Panic buying is the textbook example. The original shortage is small; the response to the perception of shortage creates the actual shortage.
Side Effect
A secondary and usually adverse effect. Merriam-Webster
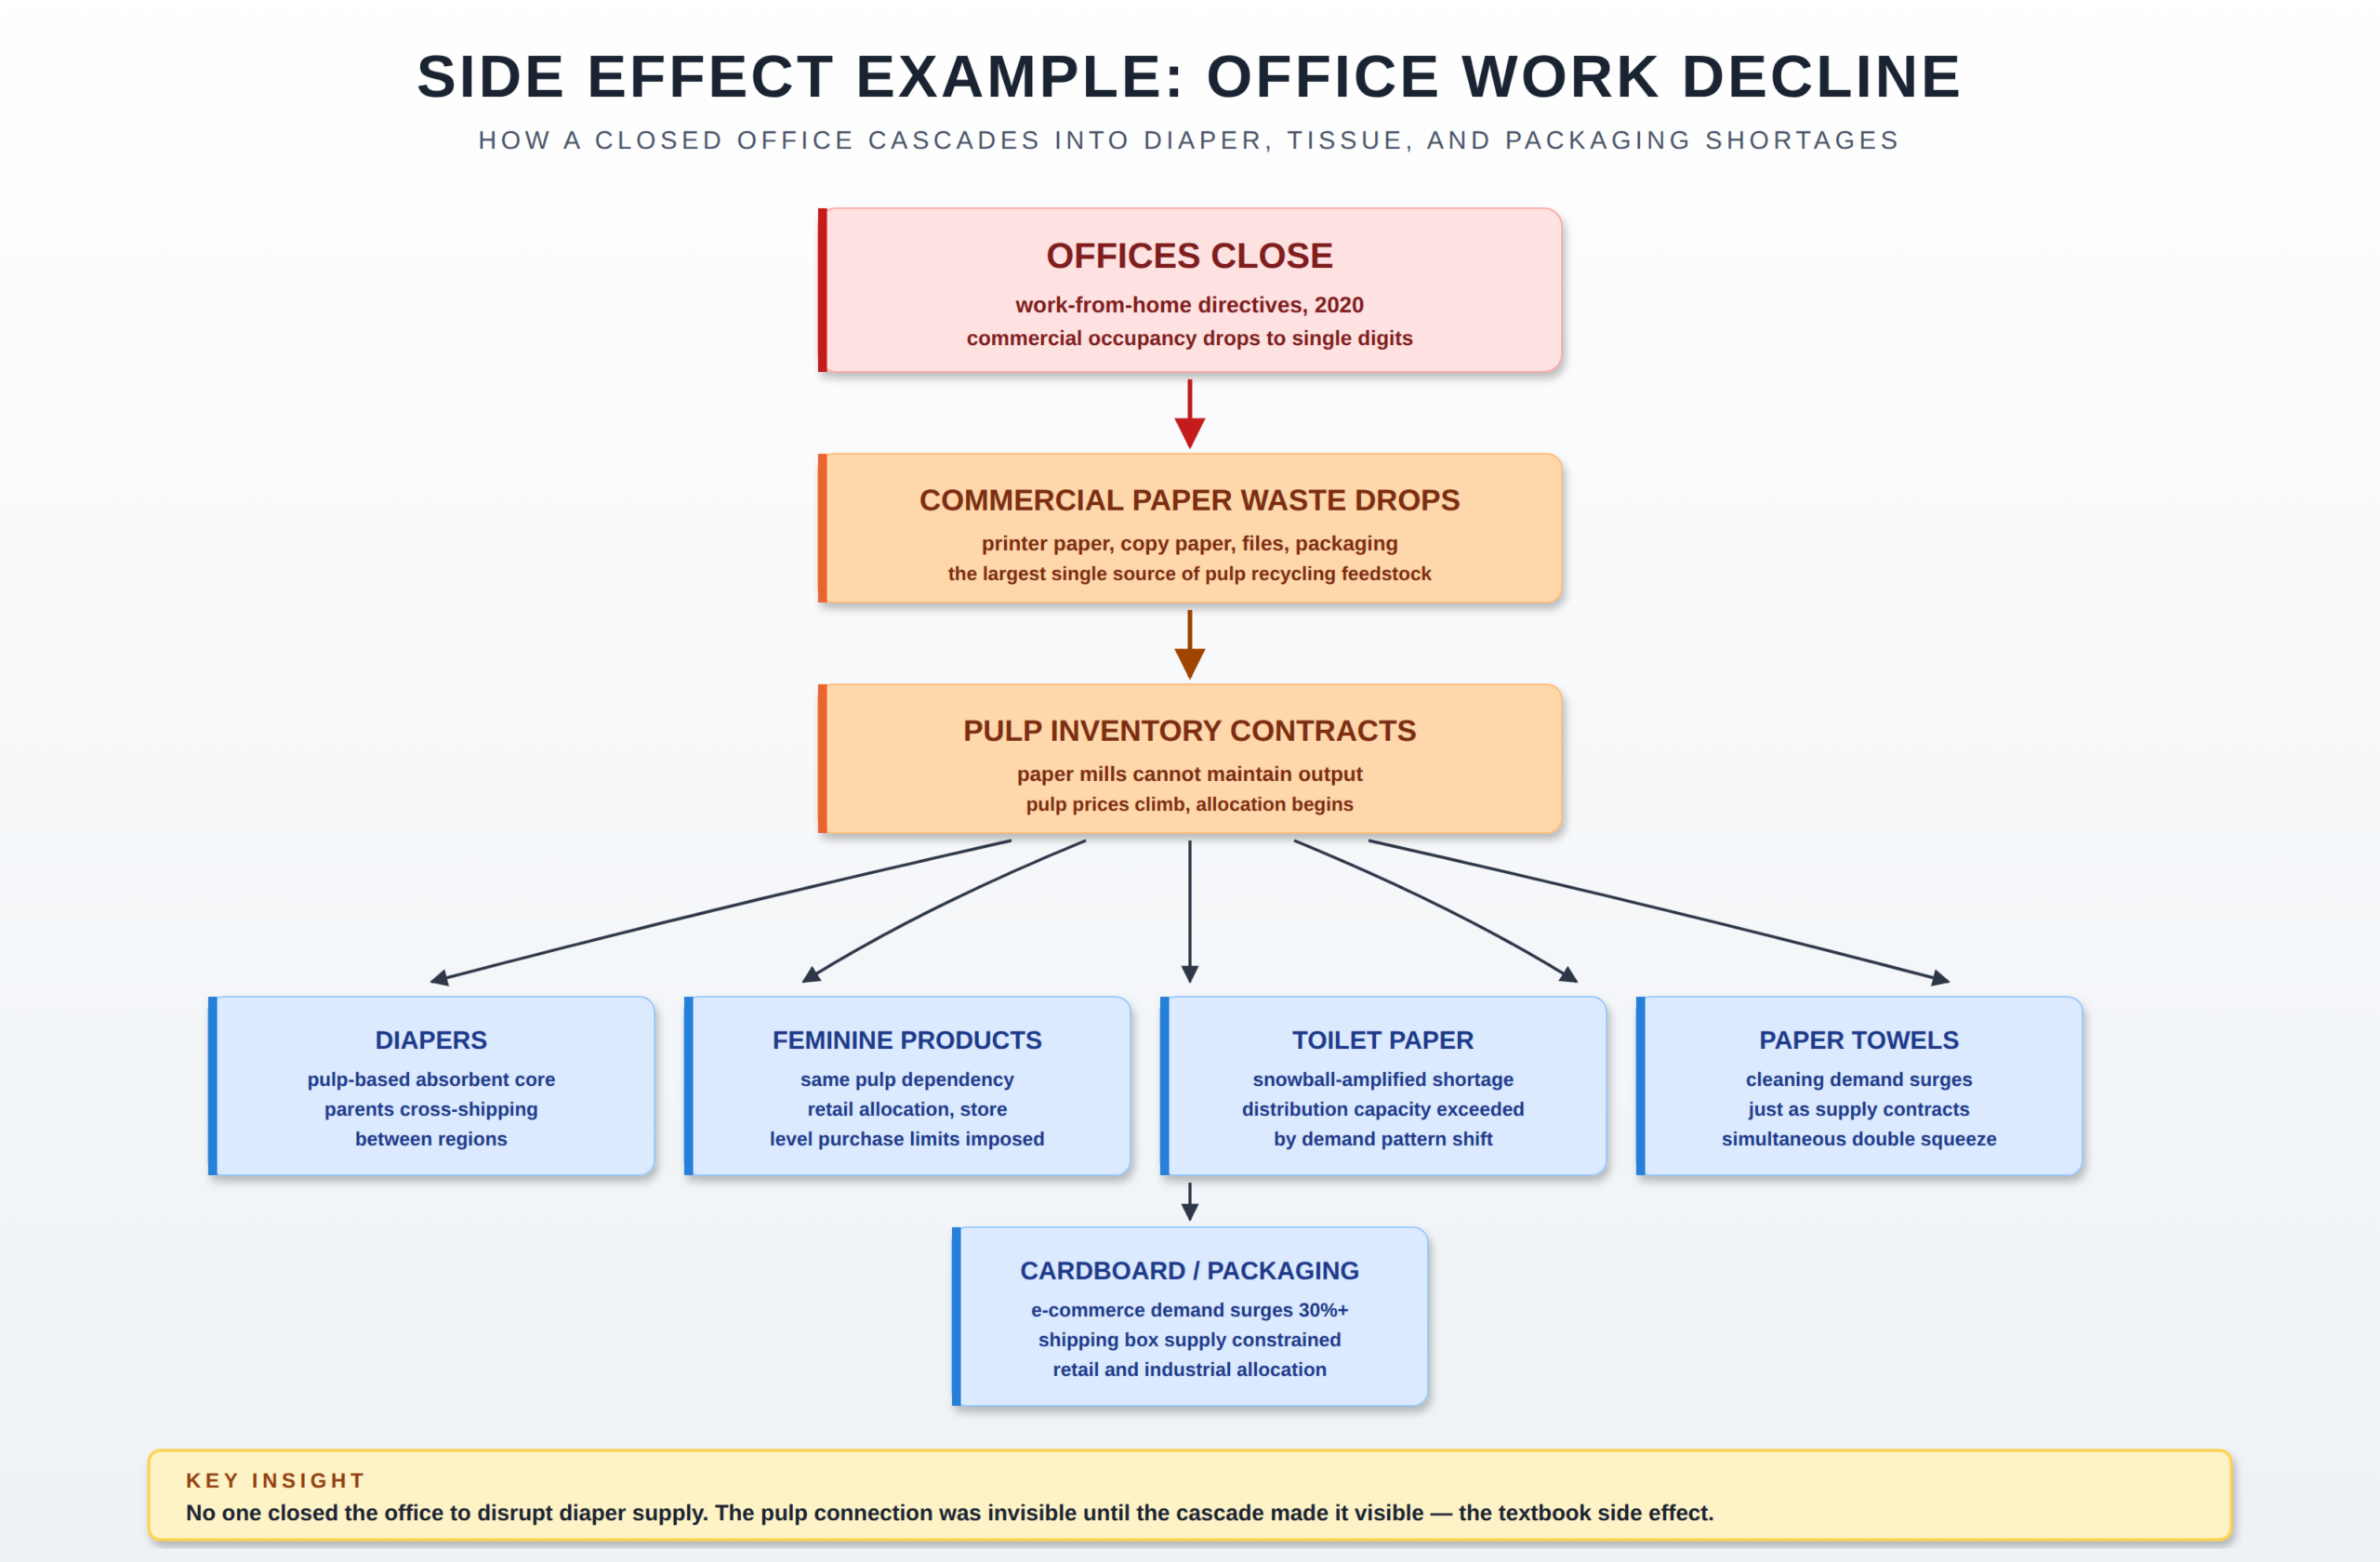
Side effects are the second-order consequences of an intended action. The decision to close offices to reduce viral transmission has the side effect of collapsing demand for commercial paper waste, which has the side effect of reducing pulp supply, which has the side effect of constraining diaper and packaging production. None of those side effects were the goal. All of them happened.
The Doctrinal Frame
The six effect types describe mechanism. Readiness conditions describe posture. Community Lifelines describe consequence. The three work together.
A single ripple may not move a readiness condition at all. A confirmed cascade crossing two or more critical lifelines should. The current Fortune Favors the Prepared readiness architecture provides the signal layer:
- PREP-CON — household and family preparedness posture. Cascade indicators in food, water, power, or supply chain should be the primary driver of PREP-CON elevation.
- COMCON — communications readiness. Telecom, cellular, internet, and broadcast cascades drive COMCON.
- CONCON — civilian continuity. Government services, public safety, and economic continuity cascades drive CONCON.
The FEMA Community Lifelines construct provides the consequence layer. The seven lifelines — Safety and Security; Food, Hydration, Shelter; Health and Medical; Energy; Communications; Transportation; and Hazardous Materials and Water Systems — are the most fundamental services in any community. When stabilized, everything else can function. When disrupted, decisive intervention is required. Cascade effects almost always show up on a lifeline dashboard before they show up in the news.
The decision rule is simple. When you can identify two or more of the six effect types operating concurrently against two or more lifelines, your readiness posture should not still be at baseline. Cascades are not a rationale for panic. They are a rationale for acting before the people around you do.
Worked Case Studies
Each case study below is decomposed into the initial event, the first-order ripple, the second-order cascade, and the third-order systemic impact. Each closes with two reads: what it meant for the prepared person and what it meant for the emergency manager, plus the Community Lifelines that were touched.
Case Study 1: Colonial Pipeline Ransomware Attack (May 2021)
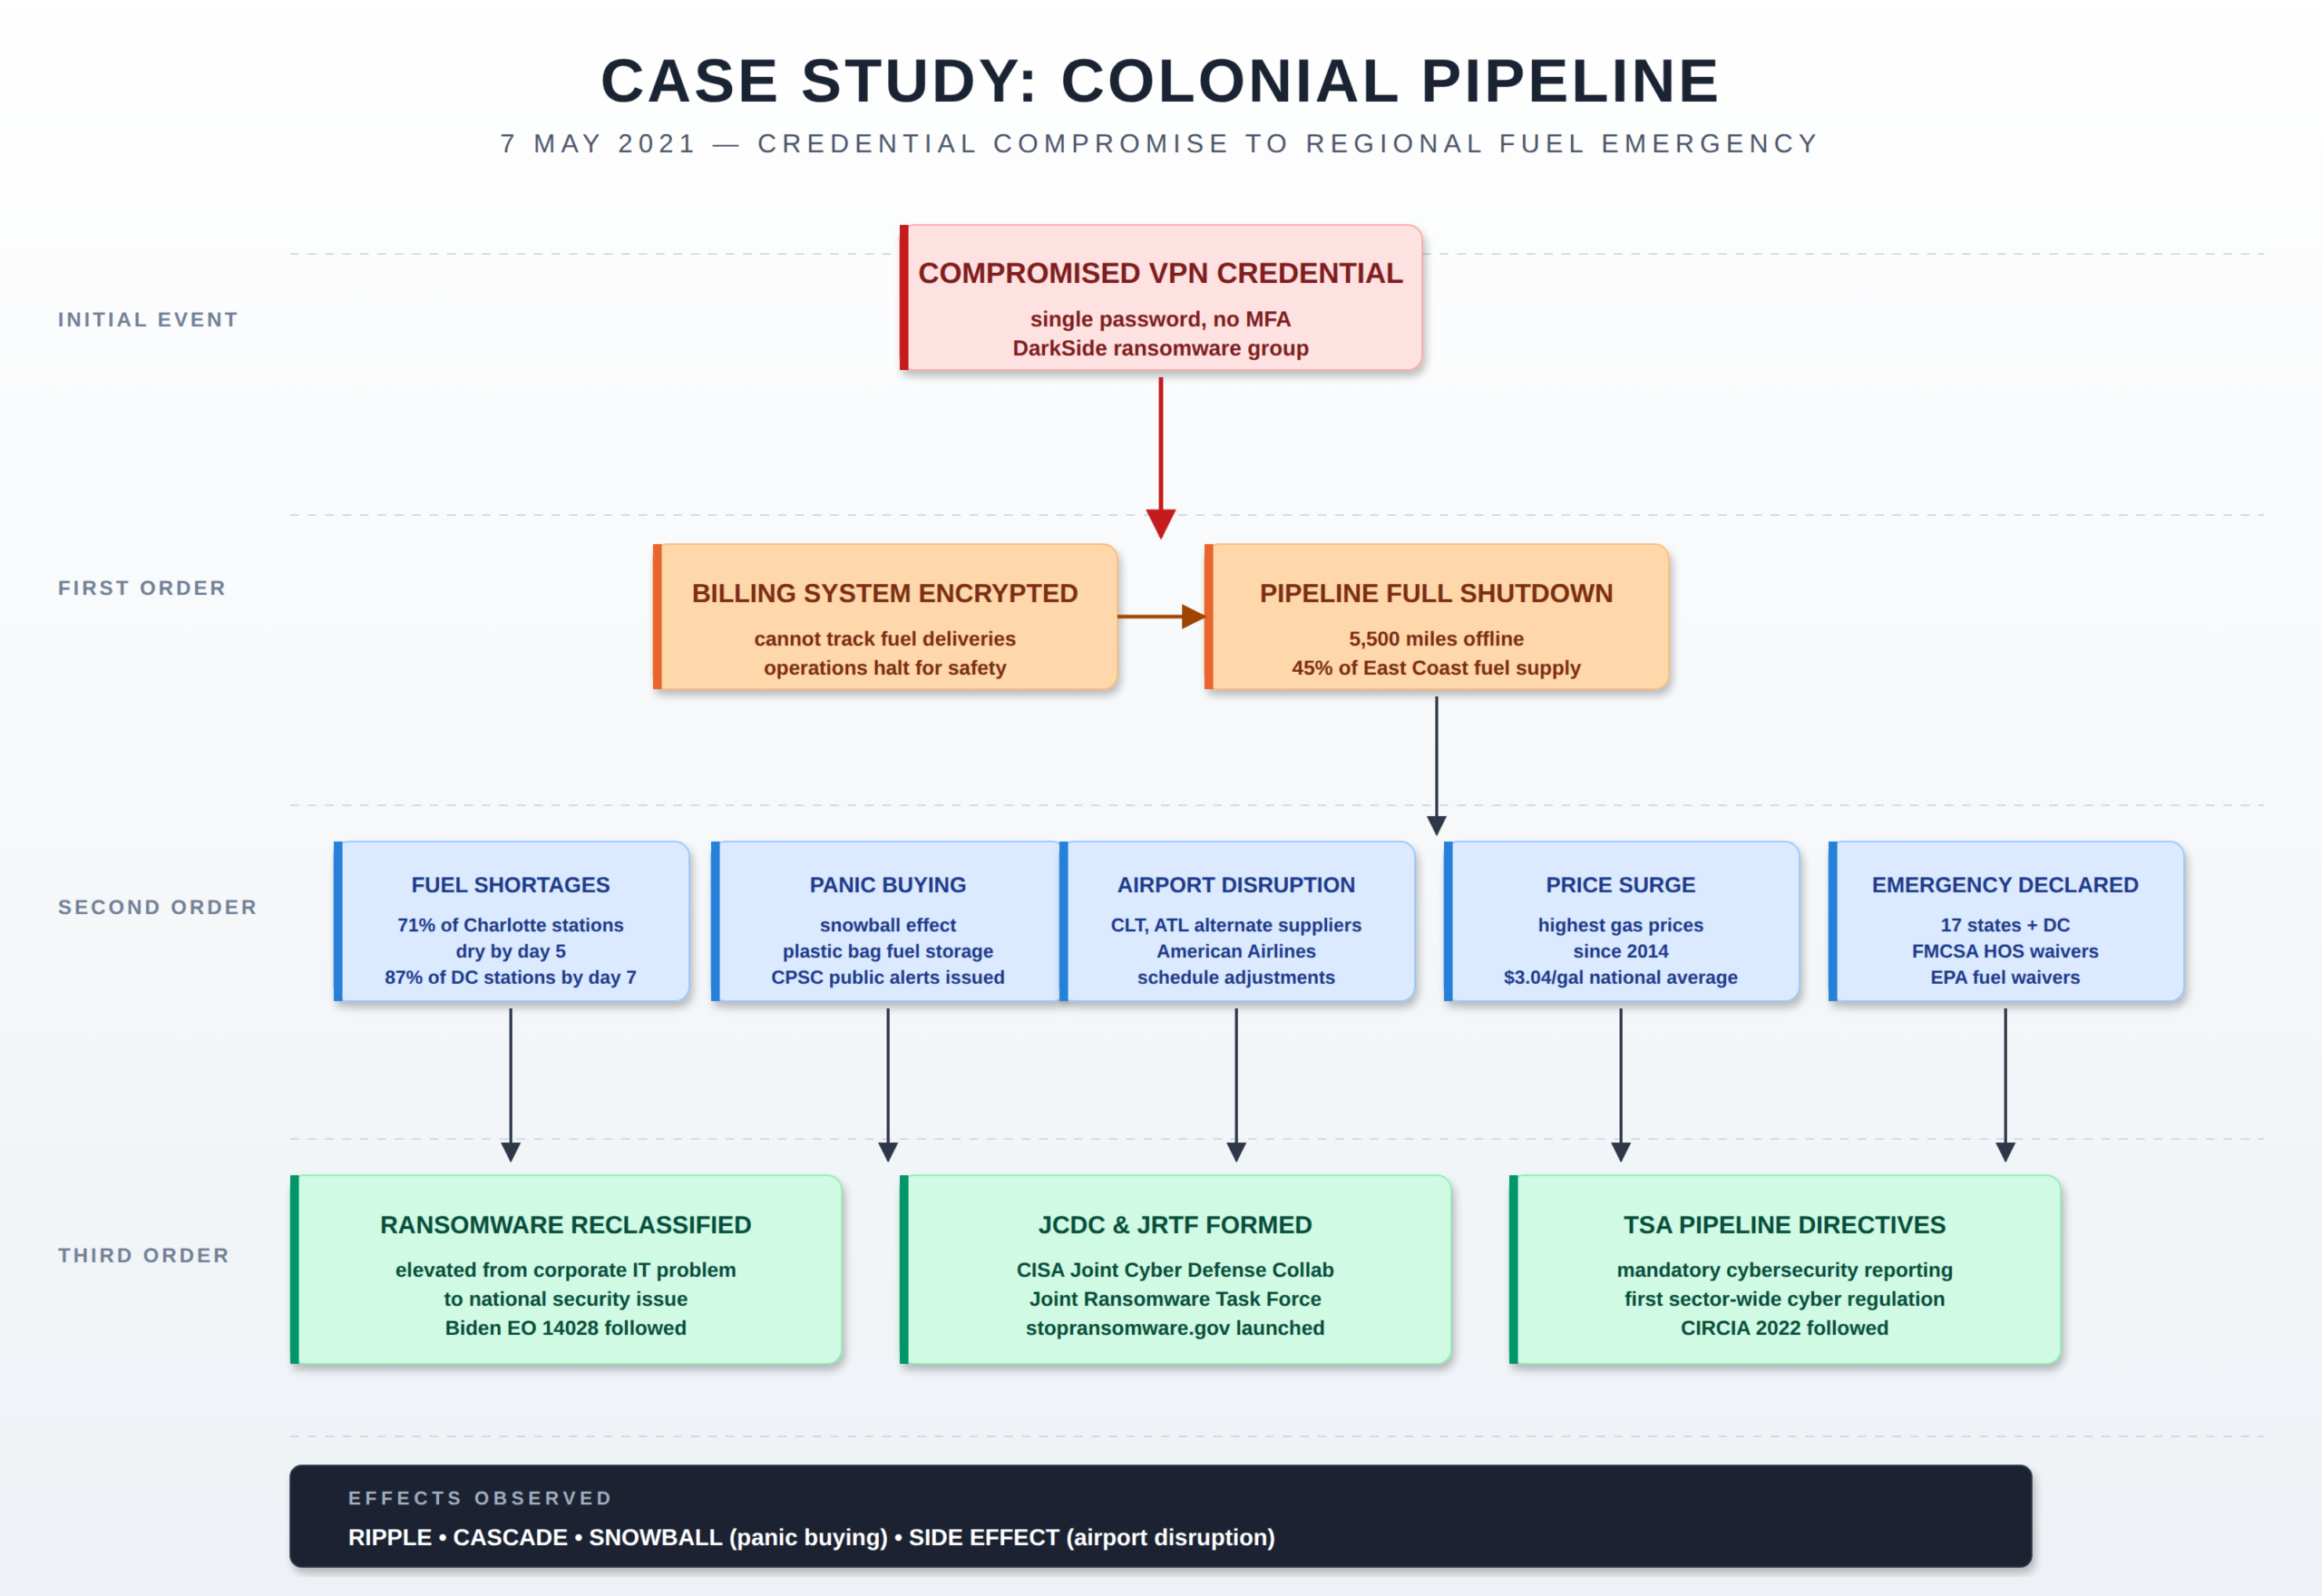
On May 7, 2021, the DarkSide ransomware group encrypted Colonial Pipeline’s billing infrastructure after gaining access through a single compromised VPN password without multi-factor authentication. The operational pipeline systems themselves were never directly compromised.
Colonial proactively shut down the entire 5,500-mile pipeline because the company could not bill for fuel it could not track. The pipeline carries roughly 45 percent of the fuel consumed on the East Coast.
Fuel shortages began emerging at filling stations on day four. Panic buying accelerated the depletion. By May 11, 71 percent of filling stations in Charlotte were out of fuel; by May 14, 87 percent of stations in Washington, D.C., had run dry. Airports including Charlotte Douglas and Hartsfield-Jackson Atlanta had to adjust flight schedules and source alternative jet fuel suppliers. The federal government issued a regional emergency declaration covering 17 states and the District of Columbia. Average national gasoline prices reached their highest level in six years.
The incident reframed ransomware in the United States from a corporate IT problem into a national security issue. CISA established the Joint Ransomware Task Force and the Joint Cyber Defense Collaborative in direct response. Pipeline operators became subject to new mandatory cybersecurity reporting requirements from the Transportation Security Administration. The Colonial event remains the canonical example of how a single-credential authentication failure in a non-operational system can cascade into a regional fuel emergency.
The Colonial event is the textbook argument for keeping a useful fuel reserve and not relying on the gauge. Households with a half-tank rule and a few jerry cans of treated fuel were never in the line at the station. Households running on fumes were standing in line behind people filling plastic bags, which is exactly when the CPSC had to issue a public alert because people were storing gasoline unsafely.
The PREP-CON elevation trigger here is supply chain stress in a fundamental commodity. By day three, before the major news cycle peaked, the cascade indicators were already visible: confirmed pipeline shutdown, no public restart timeline, panic-buying behavior emerging. That is the window for filling tanks, topping reserves, and consolidating non-essential travel. Day six is too late.
Colonial was a textbook lifeline cascade. Energy was the primary impact, but the secondary effects propagated into Transportation (commercial aviation jet fuel sourcing, FMCSA hours-of-service waivers for fuel trucking) and into Safety and Security (state of emergency declarations across 17 states, federal coordination, CISA engagement). The cascade was driven not by the cyber event itself but by the operator’s decision to shut down the operational pipeline because the billing system was encrypted. That is a Continuity of Operations decision point that should be planned for in advance, not improvised under pressure.
The operational lesson for emergency managers is that the cascade indicators were visible early. By 9 May the cascade was forecastable from open-source reporting alone. Watch floors that elevated to enhanced posture on 9 May had two days of cycle time advantage over those that waited for the federal declaration on 11 May. The standing question for any sector is which single-credential or single-system failure could trigger a similar operational shutdown decision, and the answer should be in writing before the event.
Case Study 2: COVID-19 Supply Chain Disruption (2020 to 2022)
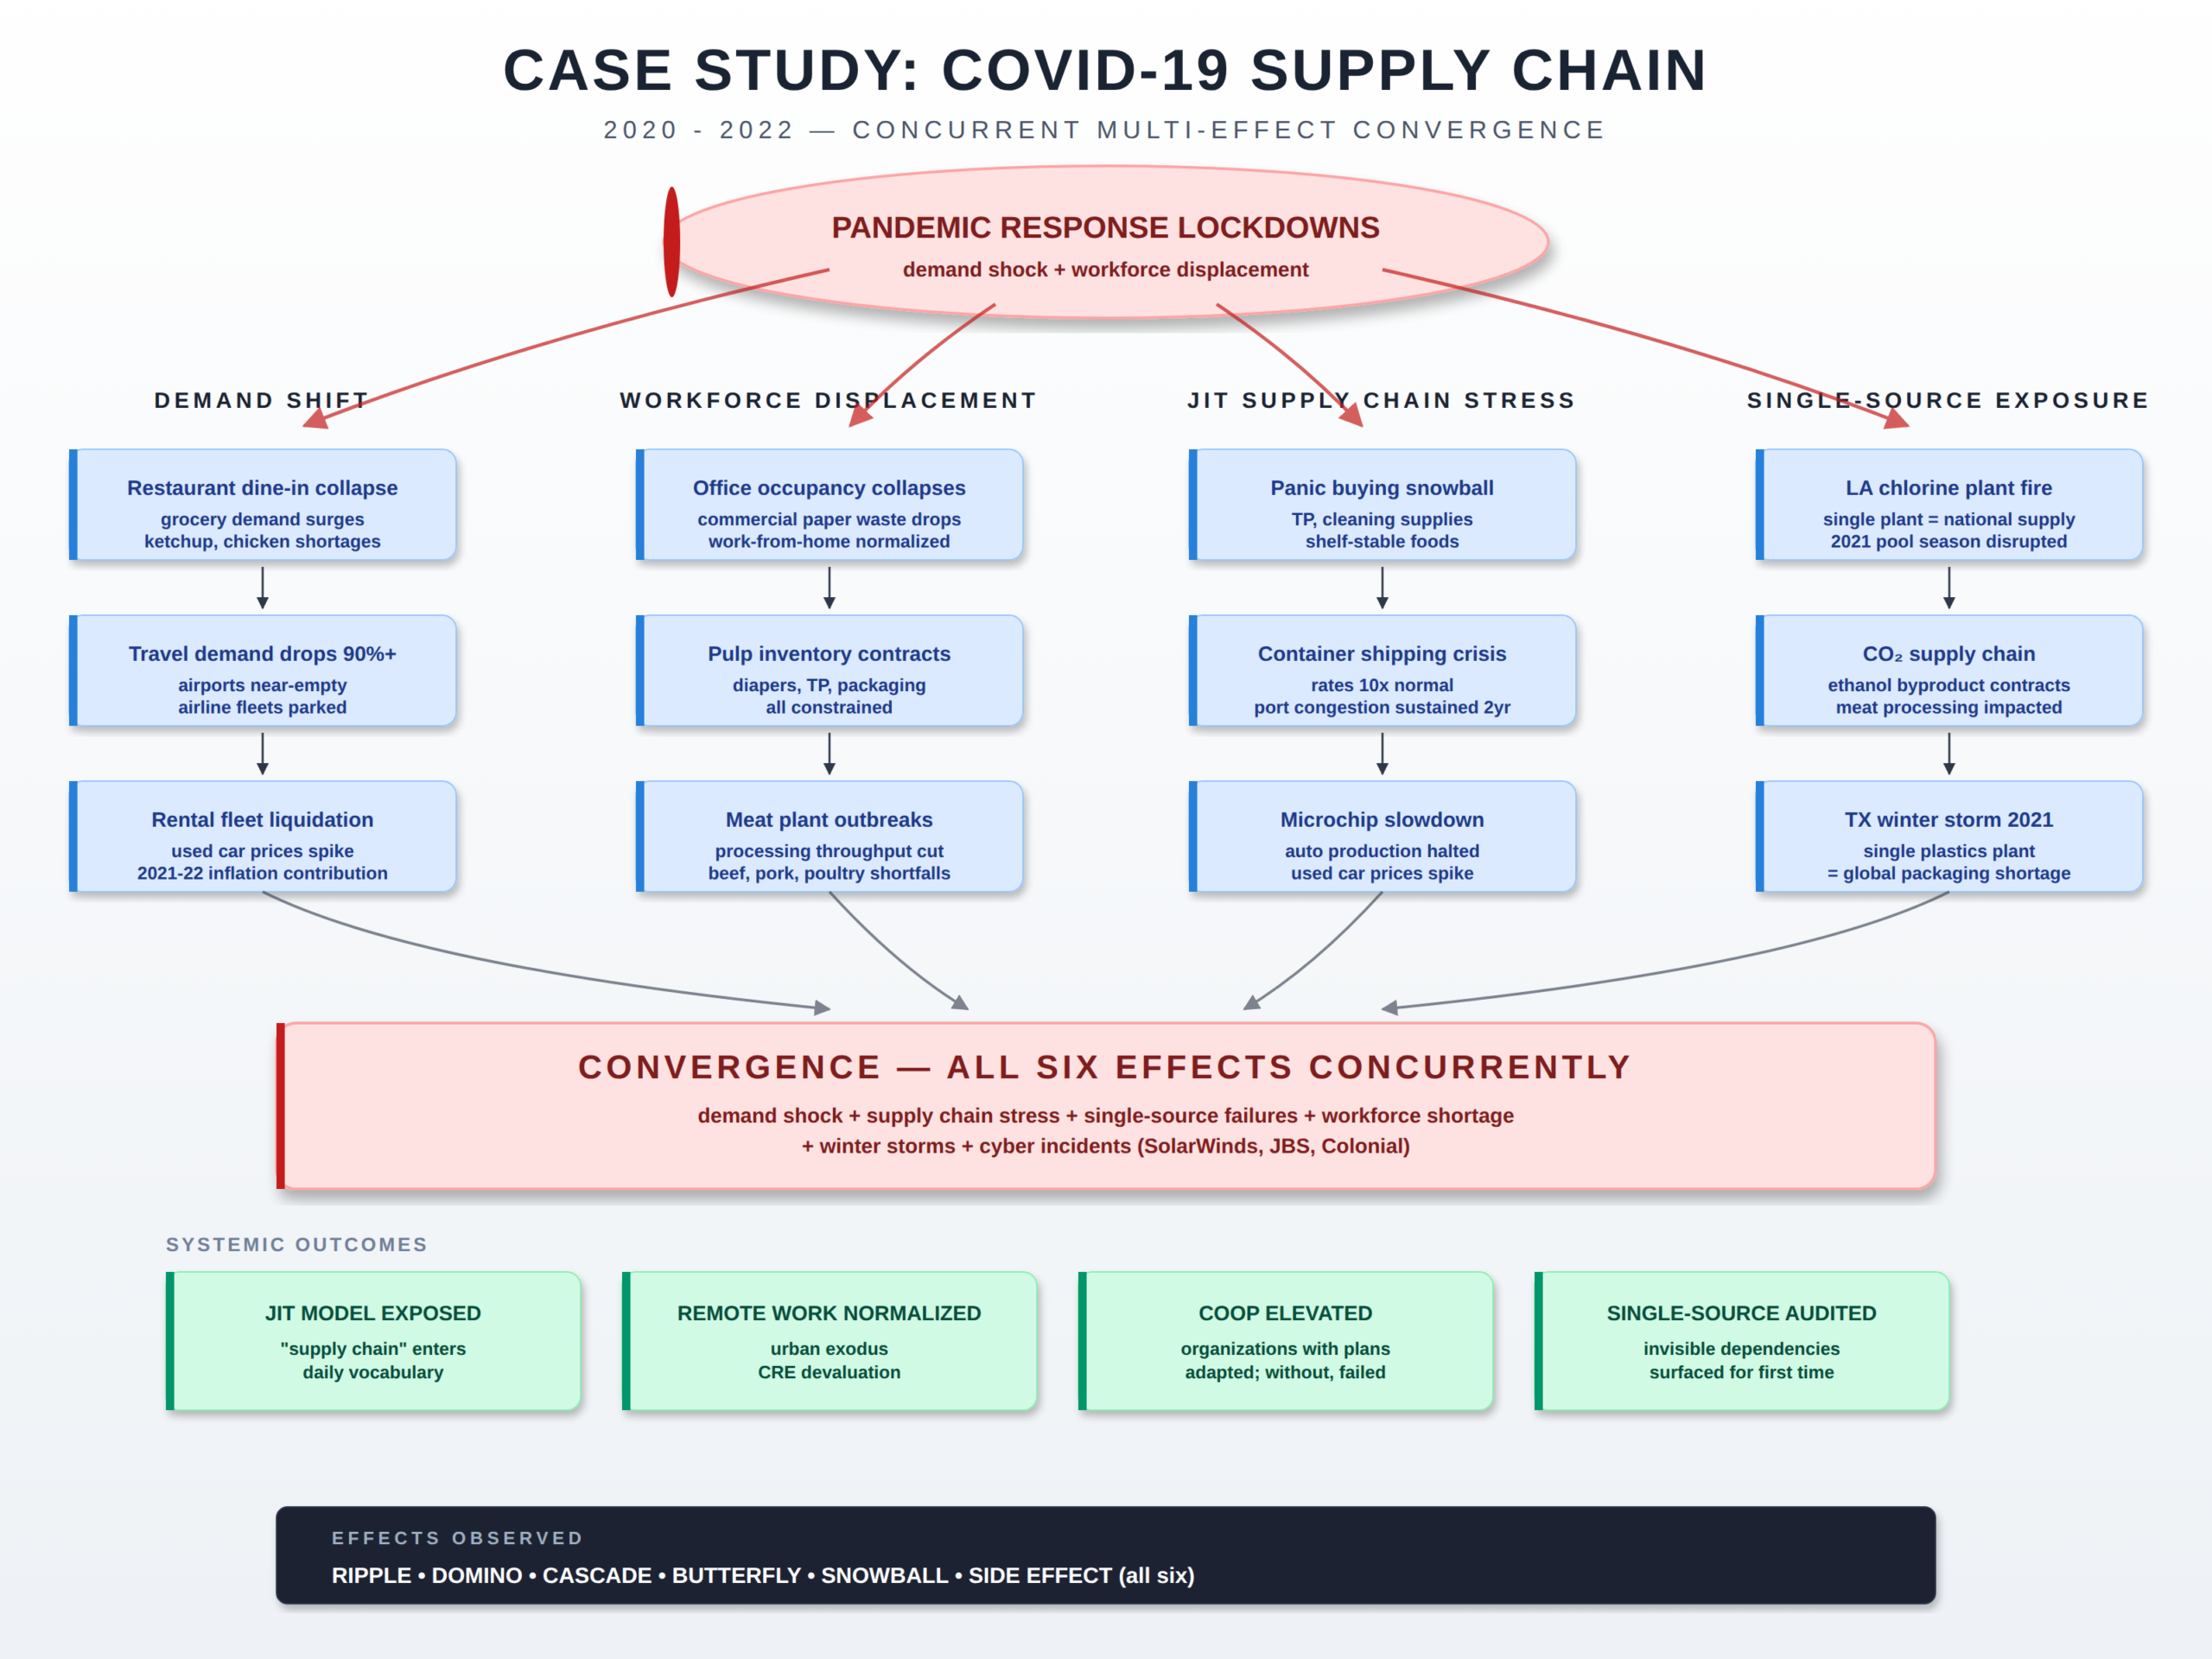
A novel respiratory virus emerged in late 2019 and triggered widespread non-pharmaceutical interventions across most of the world in the first quarter of 2020, including stay-at-home orders, business closures, and travel restrictions.
Demand patterns shifted overnight. Restaurant dining collapsed; grocery demand surged. Office occupancy dropped to single-digit percentages in major cities. Air travel demand fell by more than 90 percent in the early weeks.
The just-in-time supply chain, designed for steady predictable demand, could not absorb the demand shock. Toilet paper, paper towels, cleaning supplies, and shelf-stable foods experienced acute shortages driven less by absolute supply constraints than by the inability of distribution networks to redirect volume at speed. Commercial paper waste from offices collapsed, reducing pulp inventory available for diaper and packaging production. Meat processing plants experienced workforce outbreaks, reducing throughput. Microchip production slowed as Asian manufacturing reduced shifts, eventually constraining automotive production and driving used vehicle prices to historic highs.
Single-source dependencies that had been invisible became visible. The chlorine supply for residential pools depended on a single Louisiana plant; when it burned in 2020, the 2021 pool season was disrupted. Carbon dioxide supply for meat processing depended on ethanol byproduct streams that contracted when fuel demand contracted. Container shipping rates rose nearly tenfold and remained elevated for two years. The phrase supply chain moved from logistics jargon into everyday vocabulary.
COVID is the case study that built most of modern household preparedness culture. The households that fared best in spring 2020 were not the ones with the largest stockpiles but the ones with layered preparedness: a reasonable food reserve, water storage and treatment, basic medical supplies, alternative cooking and heating capability, and a small network of trusted neighbors or family. The ones that struggled were the ones who relied on weekly grocery trips and 48-hour Amazon delivery.
The PREP-CON architecture would have escalated this event in tiers: a watching posture in January 2020, an enhanced posture in late February, and a full elevated posture by mid-March. Households operating on that timeline were ahead of the panic buying. The compounding lesson is that a cascade involving every lifeline is not a four-week event; it is a 24-month event. Plan inventory accordingly. The Daily Threat Report indicator framework was developed in the wake of this event precisely because the indicators were trackable in real time and most people missed them.
COVID was a stress test for every emergency management framework at every level of government. The lifeline construct itself was validated in part by the COVID response and the experience drove the FEMA review that produced the 2024 Lifelines construct update. The operational reality on the ground was that emergency managers spent two years running concurrent activations across all seven lifelines simultaneously — a workload the construct was not originally scoped for.
The doctrinal lesson is that not every cascade is a four-week activation. Continuity plans, staffing rotations, mental health support for responders, and family support for EOC staff need to be sized for a sustained multi-year event, not just a 30-day surge. The single-source dependency lesson — chlorine, CO₂, microchips, container shipping — is now a standing entry on most emergency management hazard assessments. It was not before COVID.
Case Study 3: CrowdStrike Falcon Update (July 2024)
On July 19, 2024, CrowdStrike pushed a faulty rapid response content configuration update to its Falcon Sensor endpoint protection product. Approximately 8.5 million Microsoft Windows systems worldwide crashed into the blue screen of death within hours.
Affected systems would not boot. Recovery required manual intervention at each device, and many of the affected systems were behind disk encryption that complicated the recovery procedure. There was no remote fix.
Aviation took the hardest visible hit. Approximately 16,896 flights were cancelled in a 72-hour period, roughly 4 percent of global flights. Delta Air Lines, whose crew scheduling system ran heavily on affected Windows infrastructure, was disabled for five days and lost an estimated 500 million dollars. Healthcare providers lost access to electronic health records and reverted to paper. Banks experienced transaction processing disruptions. Emergency call centers in several jurisdictions lost dispatch systems and ran on backup procedures.
Direct losses to Fortune 500 companies alone exceeded 5 billion dollars, with healthcare estimated at 1.94 billion and banking at 1.15 billion. The incident exposed the systemic risk of single-vendor concentration in cybersecurity tooling and the brittleness of automatic update channels with insufficient regression testing. Boards across multiple sectors initiated reviews of third-party concentration risk. The CrowdStrike event is now the canonical example of how a single vendor’s software release process can become a critical infrastructure dependency that no operator deliberately chose.
CrowdStrike is the case for households having a working analog fallback. People who had paper copies of medications, written emergency contact lists, cash on hand, and the ability to function without a working app for 72 hours were inconvenienced. People who could not check in for a flight because the airline kiosk was down, could not look up their prescription because the pharmacy system was down, and could not access cash because the bank ATM was down had a much worse week.
The communications lesson is direct: build a P.A.C.E. plan for your own information flow. Primary, alternate, contingency, emergency. If the primary path is a smartphone app, the alternate had better not also depend on the same cloud provider or the same identity broker. The single-vendor concentration risk that hit Falcon is the same risk that runs through every consumer cloud service.
CrowdStrike was a hands-on demonstration of how a single vendor’s software release process is a critical infrastructure dependency. The 911 dispatch impact in several jurisdictions, the airline crew scheduling collapse, and the EHR outages would each be a major activation on their own. They happened simultaneously because they shared a single root cause that no emergency manager had on a hazard assessment.
The doctrinal implications run deep. Sector-wide concurrent activations driven by IT vendor incidents are now a foreseeable scenario. Mutual aid agreements that assume neighboring jurisdictions can step up are weaker if the neighboring jurisdiction is running the same vendor stack and is therefore in the same condition. The standing question for any emergency manager is which third-party software vendor’s release pipeline could degrade dispatch, EHR, or critical scheduling in this jurisdiction, and the answer should be backed by an actual test of the analog fallback procedures rather than a paper plan.
Case Study 4: Francis Scott Key Bridge Collapse (March 2024)
At approximately 0128 local time on March 26, 2024, the container ship Dali lost propulsion and electrical power on departure from the Port of Baltimore and struck a support pier of the Francis Scott Key Bridge. The bridge collapsed within seconds. Six construction workers on the bridge were killed.
The collapsed structure blocked the only deep-water shipping channel into and out of the Port of Baltimore, the ninth largest U.S. port for international cargo and the largest U.S. port for imported and exported automobiles. The port closed indefinitely to deep-draft vessels.
Ships already in port could not leave. Inbound ships were diverted to Norfolk, the Port of New York and New Jersey, Charleston, and Savannah. Auto imports rerouted, with manufacturer logistics networks absorbing additional inland transportation costs. John Deere agricultural equipment that normally moved by rail from Iowa to Baltimore was rerouted to Brunswick, Georgia, by truck. Coal exports, the second largest commodity at Baltimore, were displaced. Cruise lines including Carnival and Royal Caribbean rerouted passengers to Norfolk.
A temporary channel was opened within weeks and the full channel by late May 2024. Baltimore retained the bulk of its automotive business but lost some container traffic permanently to competing East Coast ports. Bridge reconstruction is projected to cost more than 2 billion dollars and require multiple years. The event prompted reviews of bridge protection design across U.S. ports handling post-Panamax vessels and renewed federal attention to maritime cybersecurity given the Dali’s loss-of-power event.
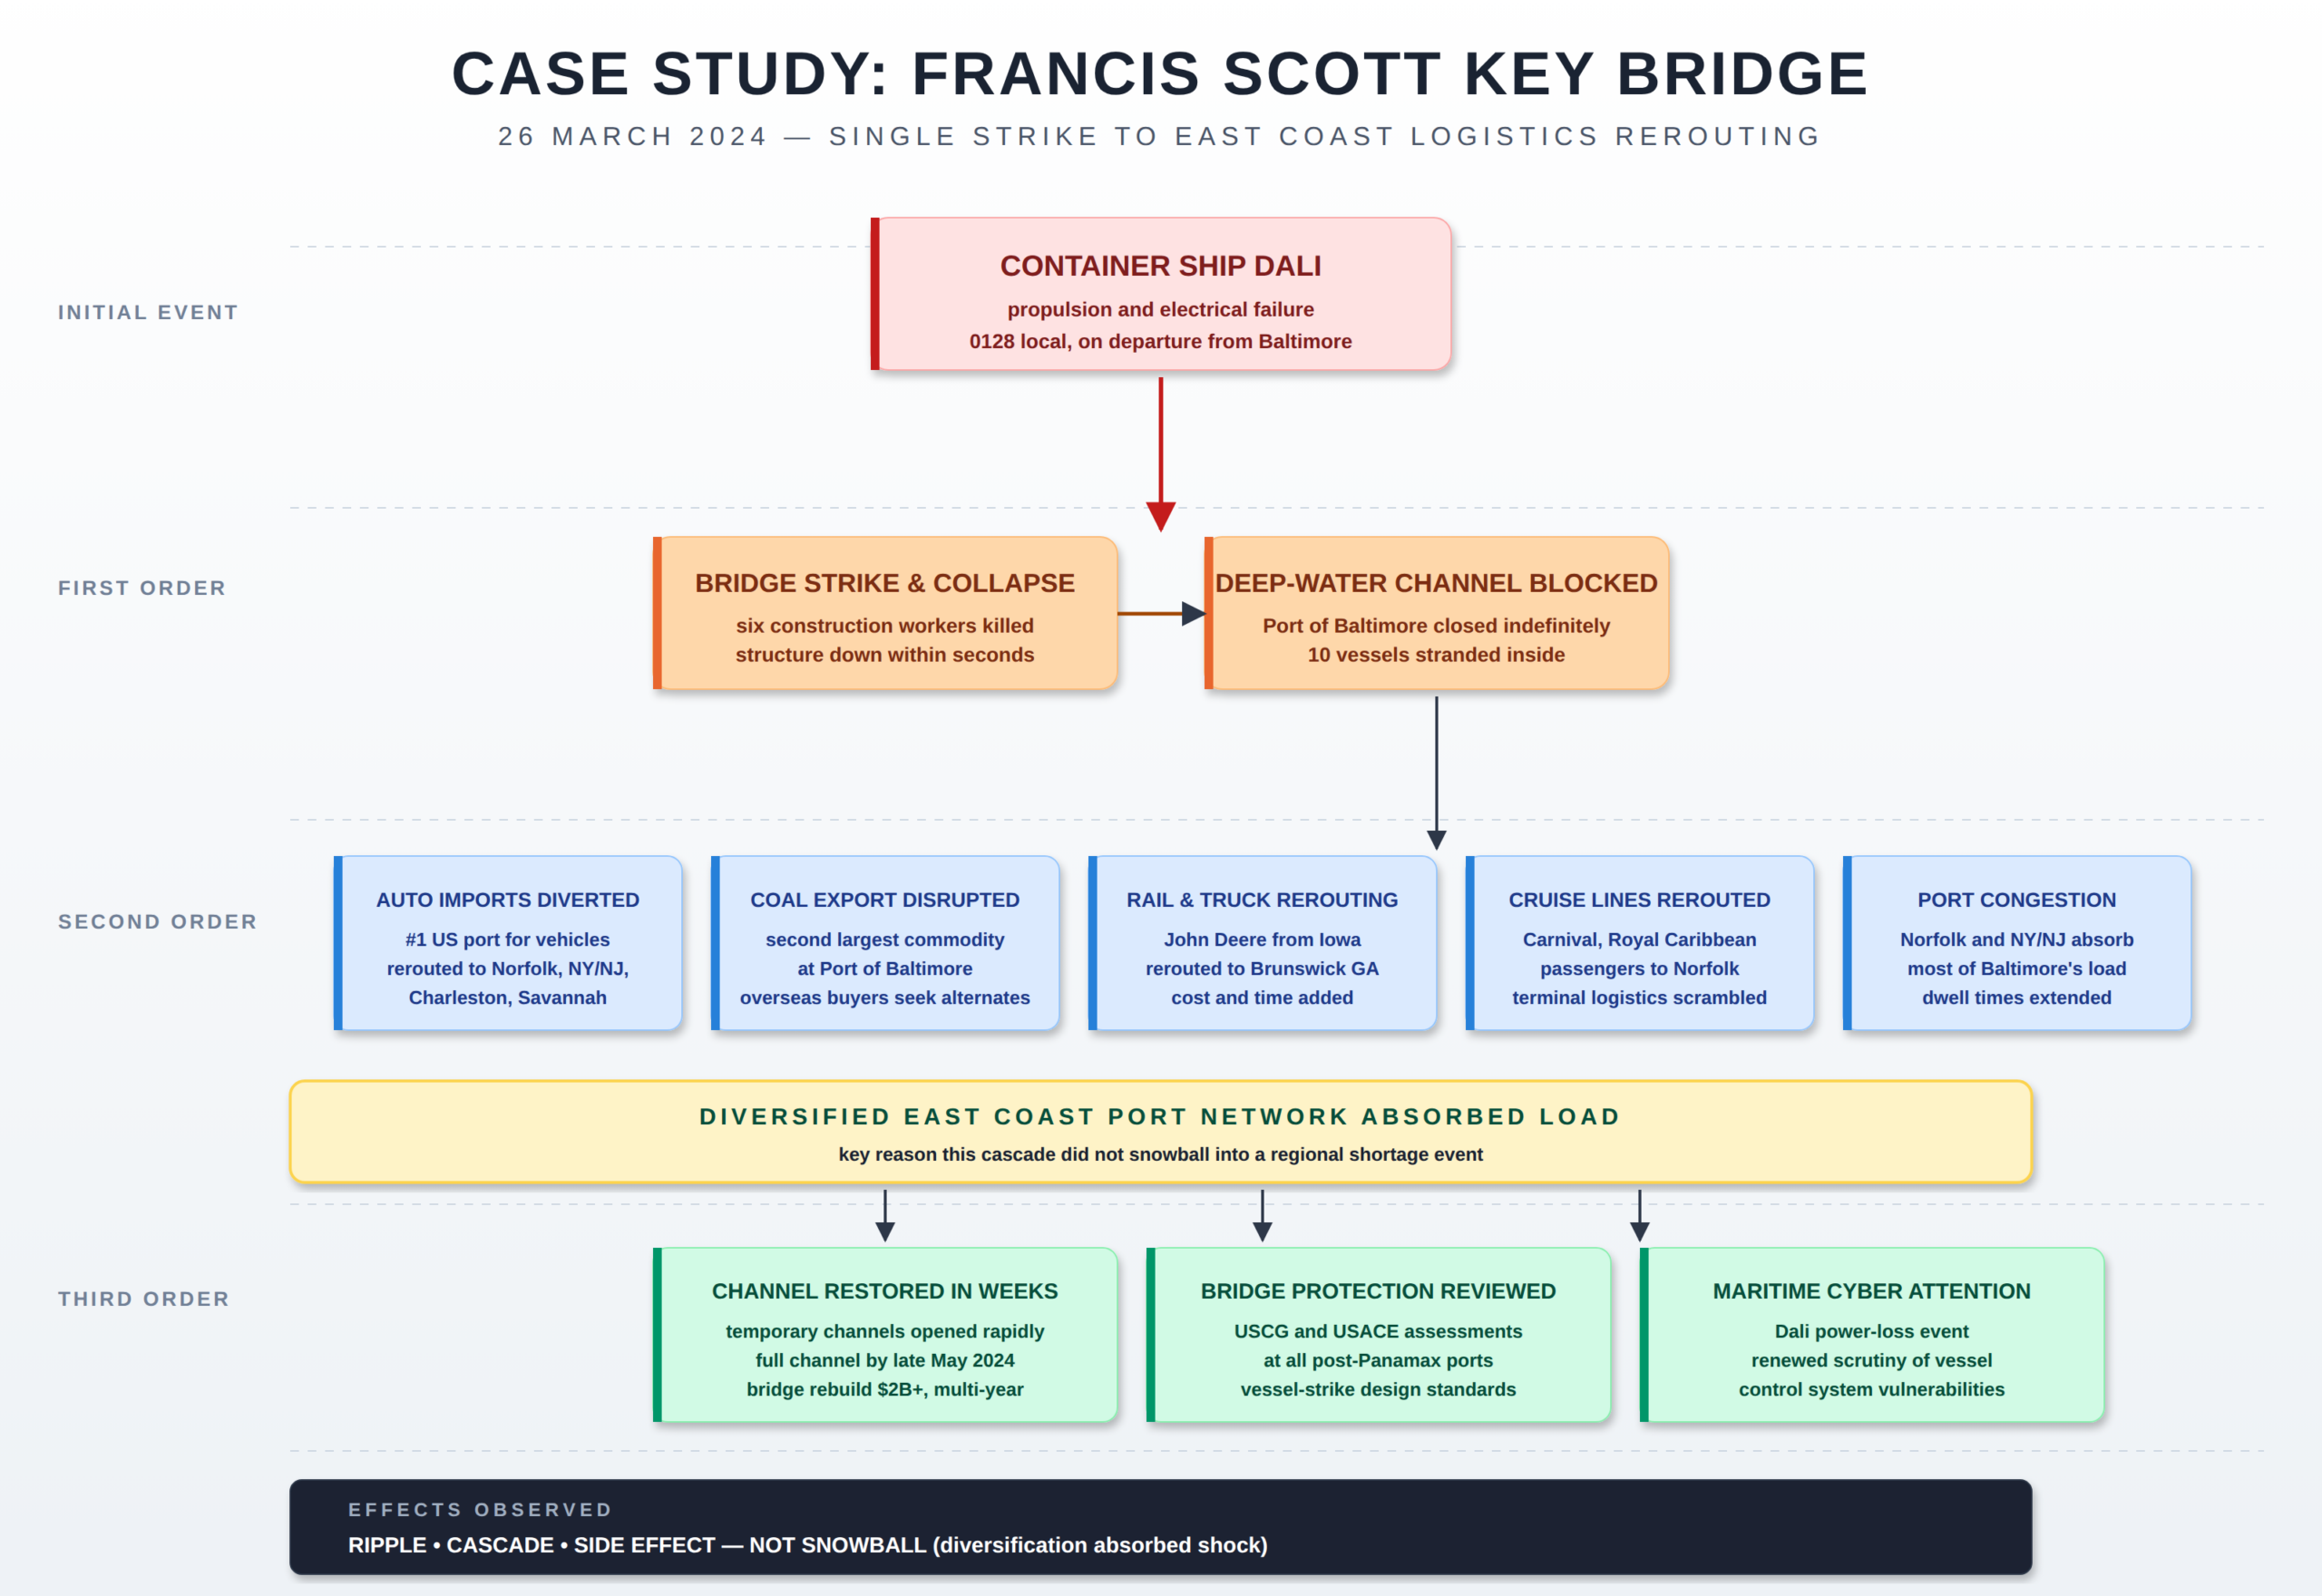
The Key Bridge collapse is the case study where preparation at the system level prevented the cascade from reaching households. The reason most people on the East Coast did not notice the closure of the Port of Baltimore is that other ports absorbed the load. Diversification at the upstream layer protected the consumer. That is what redundancy looks like working as intended.
The lesson for the prepared household is to think about local diversification the same way. A single grocery store, a single pharmacy, a single fuel station, a single primary route to and from home are all single points of failure. The Key Bridge worked out because there were five other major ports within a day’s redirect. Your personal infrastructure should be built the same way.
Key Bridge is the case study where emergency management worked. Unified command stood up rapidly. Lifeline status was tracked through the response with clear color-coded transitions from red to yellow to green as each component stabilized. The diversified East Coast port network functioned as the resilience layer the FEMA Lifelines construct anticipates. This is the worked example of how an objectives-based, lifeline-stabilization-driven response handles a complex incident.
The doctrinal lessons are reinforcement rather than reversal. Pre-existing mutual aid relationships with neighboring port authorities, USACE channel management capability, and the USCG’s debris and salvage doctrine all functioned as designed. The cascade was absorbed because resilience had been built into the system before the event. The remaining attention area is the upstream cyber question: maritime control system vulnerabilities that could produce Dali-class events under deliberate rather than accidental conditions. That is a hazard that should be on every coastal jurisdiction’s assessment.
How to Spot a Cascade Forming
The cascade is most actionable in the hours and days before the consumer notices it. By the time the panic buying starts, the window for low-cost preparation is already closed. The signals below are the early indicators a watch floor or a household can monitor.
Single-source manufacturing alerts
A fire, explosion, cyber incident, or labor action at a plant that produces most of a category in a region. Chlorine, semiconductors, lubricants, packaging plastics, and specialty chemicals all run on single-source production for major SKUs. One plant down can equal a national shortage in eight to twelve weeks.
Single-vendor software concentration
When the same endpoint protection, identity provider, or cloud platform serves a majority of critical operators in a sector, a vendor incident becomes a sector incident. Watch for vendor advisories, emergency patches, and incident response activations.
Just-in-time inventory stress
Container dwell times, port queue depths, rail car cycle times, and trucking spot rates are all leading indicators. When two or more move sharply in the same week, supply chain stress is building.
Workforce concentration shocks
A workforce health event, strike, or sudden demand shift that removes 20 percent or more of throughput at a critical node. Meat processing in 2020, port labor in 2021 and 2022, and aviation flight crews in multiple recent years are examples.
Concurrent low-probability events
Cascades become perfect storms when independent low-probability events align in time. A hurricane during a fuel shortage. A cyber incident during a heat dome. A bridge strike during a port labor negotiation. The independent probabilities multiply downward; the combined consequence multiplies upward.
Information environment confusion
When official sources are silent, contradictory, or slow, social media fills the gap. Crowd-sourced concern accelerates the snowball before the underlying disruption fully materializes. Watch the gap between authoritative reporting and viral discussion. The gap is the snowball window.
Lifeline status convergence
For the emergency management practitioner specifically: when two or more lifelines move from green to yellow within the same operational period, the cascade is no longer theoretical. The FEMA Community Lifelines dashboard is built precisely for this signal.
The Fortune Favors the Prepared Daily Threat Report product line is built around these indicators. The DTR Full and sector editions explicitly track lifeline status, single-source dependencies, and concurrent-event convergence as part of the standing analytical framework.
What to Do
Cascade analysis without action is journalism. The point of seeing the storm forming is to be in position before it lands. The actions below split by reader.
For the Prepared Person, Household, or Group
Make a plan
Start with the Family Emergency Plan and the FEP Workbook. Develop triggers tied to cascade indicators so your readiness posture moves before the news cycle does. Consider the ASAR for structured external assessment.
Build the lifeline buffer
Water storage with treatment. Food storage sized to your household. Backup power sized to keep food cold and communications running, with fuel and parts to sustain it.
Build the network
Cascades reward redundancy, and redundancy is cheaper when shared. Build a Mutual Assistance Group with vetted, capable people whose skills and resources complement yours.
Train and maintain skills
Medical training for every adult. Carry an IFAK and know how to use it. Skills are the only preparation that cannot be looted or run out of inventory.
Communications plan
A cascade frequently damages the information environment first. Build a communications plan using P.A.C.E. methodology. Get your amateur radio license — Technician for local tactical work, General for HF range.
Plan for recovery
Cascades do not end when the initial event resolves. The Household Recovery Workbook addresses the recovery phase. The Next of Kin Workbook addresses the most adverse outcome.
For the Emergency Management Practitioner
Map your hazard assessment to the lifelines
Every identified hazard should be expressed in terms of which of the seven lifelines it threatens and which it depends on. The Community Lifelines construct is the common language for this work.
Identify single-source and single-vendor exposures
Which dispatch system, EHR, identity provider, fuel supplier, or essential commodity producer is the only one in your area? Those are your cascade triggers. Document them in writing before the next event.
Tie posture changes to lifeline indicators
When two or more lifelines move from green to yellow in the same operational period, that is a defensible operational trigger for elevation. Establish those triggers in SOP rather than improvising under pressure.
Test the analog fallback
Every dependency on a third-party software vendor should have a documented, exercised analog procedure. CrowdStrike validated that paper-based fallback in dispatch and EHR was decisive. Most agencies that had not tested those procedures discovered the gaps in real time.
Build sustained-event continuity
COVID demonstrated that not every cascade is a 30-day surge. Plan staffing rotations, mental health support, family support, and shift coverage for a 24-month event. The continuity plan that only contemplates a short activation breaks at the 90-day mark.
Strengthen mutual aid for concurrent events
If your neighboring jurisdictions are running the same vendor stack, the same fuel supplier, or the same regional grid, your mutual aid plan needs an out-of-region partner. Geographic and vendor diversity belong in the agreement itself.
Cascades and the Lifelines Dashboard
Cascade effects almost always show up on a lifeline dashboard before they show up in the news. The relationship between the six effect types and the seven lifelines is straightforward:
- A ripple typically touches one lifeline component and may not move the lifeline status at all.
- A cascade crosses lifeline boundaries — Energy disruption produces Transportation impact, Transportation disruption produces Food/Hydration/Shelter impact, and so on.
- A snowball is most visible in the Food/Hydration/Shelter lifeline because that is where consumer panic-buying behavior concentrates.
- A side effect is the lifeline impact no one planned for — the office closure that cascaded into the pulp shortage is the textbook case.
- A butterfly is the configuration file, the credential, or the single vessel that touches every lifeline before it stops.
- The perfect storm is what an experienced emergency manager sees when two or more lifelines move red in the same operational period and the indicators show no near-term recovery.
For the prepared household, the same dashboard logic applies at the kitchen-table scale. Energy in your home. Food, hydration, and shelter for your household. Health and medical for the people who depend on you. Communications when the cell network is degraded. Transportation when fuel is rationed. Hazardous materials when local industry is impacted. Safety and security when local response capacity is stretched. The lifelines are the prepared person’s checklist, too.
The Fortune Favors the Prepared Community Lifelines pillar page is the companion to this one. Read them together. Cascades are the mechanism; lifelines are the consequence; readiness conditions are the response.
Closing
A cascade is not a failure of imagination after the fact. It is a failure to ask the next question before the fact. The frameworks above are the next questions in checklist form. The case studies show what happens when they are not asked in time. The indicators show what to watch for so you can ask them on your own schedule, not on the news cycle’s.
The prepared practitioner is not the one who predicts the next event. The prepared practitioner is the one who has already done the work that any cascade will require, regardless of which event sets it in motion. The same is true of the emergency manager. The work in front of the event is always cheaper, faster, and more effective than the work behind it.